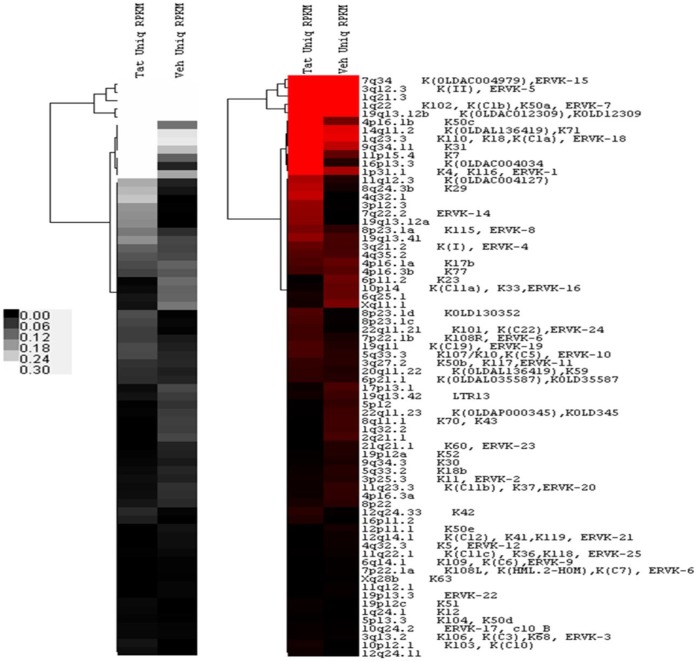
FIG 1.
Heat map of the unique sequence HERV-K (HML-2) expression levels in Tat- and vehicle-treated samples (Tat Uniq RPKM and Veh Uniq RPKM), respectively. Uniquely mapped log2 RPKM values were clustered using average linkage hierarchical clustering with the Euclidean distance matrix, as shown in the hierarchical tree. Proviruses with zero reads under both conditions were removed before clustering, resulting in 70 proviruses. The proviruses with the highest levels of expression are in white or red.

