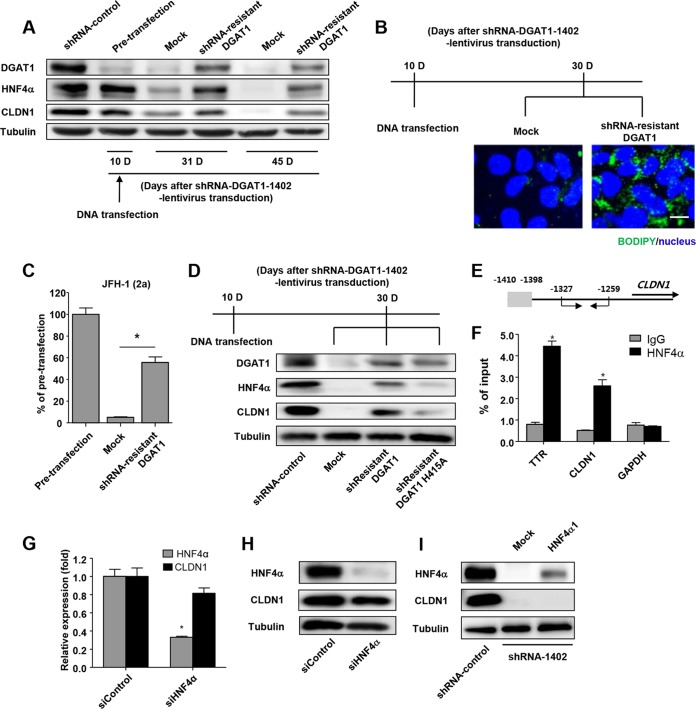
FIG 6.
Catalytically active DGAT1 is responsible for maintaining CLDN1 expression and the hepatocyte-specific phenotype in Huh-7.5 cells. (A) An shRNA-1402-resistant DGAT1 gene was constructed by introducing 6 point mutations into the sequence that is recognized by the shRNA-1402 oligonucleotide without altering the amino acid sequence. The shRNA-1402-resistant DGAT1 gene was transfected into shRNA-DGAT1-1402-harboring cells 10 days after transduction, and temporal changes in protein expression were examined. The cell pellets were harvested at days 10, 31, and 45 after transduction with lentivirus harboring shRNA-DGAT1-1402 (days 0, 21, and 35 after the shRNA-1402-resistant DGAT1 transfection) and were subjected to immunoblot analysis to detect DGAT1, HNF4α, and CLDN1. Data are representative of two independent experiments. (B) Intracellular lipid droplet staining was performed using the BODIPY lipid probe 493/503 in cells that had been transfected with mock or shRNA-resistant DGAT1. The scale bar represents 20 μm. (C) HCV entry into DGAT1-silenced cell lines was assessed after mock or shRNA-resistant DGAT1 transfection using JFH1 HCVpp. Data are expressed as percentages of the pretransfected cell line (n = 3). Bar graphs represent means ± SEM. *, P < 0.001. (D) Immunoblot analysis of DGAT1-silenced cell lines harboring a catalytically active or inactive DGAT1 gene was performed. A catalytically inactive DGAT1-encoding plasmid was constructed by site-directed mutagenesis, replacing the histidine residue at position 415 (encoded by CAU) with alanine (encoded by GCU), and the catalytically inactive DGAT1 gene was also shRNA resistant. We confirmed the sequence of the mutated construct, which was then used to transfect Huh-7.5 cells on 10 days after DGAT1 silencing. Data are representative of two independent experiments. (E, F) The chromatin immunoprecipitation assay was performed using anti-HNF4α antibody. In the schematic of the CLDN1 promoters, the putative HNF4α binding site is shaded in gray, and the positions of the primers for real-time qPCR are designated with arrows (E). Real-time qPCR analysis was performed using DNA precipitated by rabbit anti-HNF4α (clone number H171) (Santa Cruz Biotechnology, Inc.) or IgG. Transthyretin (TTR) was used as a positive control (F). *, P < 0.01 (n = 3). (G) Real-time qPCR analysis of HNF4α and CLDN1 expression in the Huh-7.5 cell line was conducted after siHNF4α treatment. Data are standardized to β-actin mRNA levels (n = 3). Bar graphs represent means ± SEM. *, P < 0.001. (H) Immunoblot analysis of HNF4α and CLDN1 in the Huh-7.5 cell line was performed after siHNF4α treatment. Data are representative of two independent experiments. (I) Immunoblot analysis of HNF4α and CLDN1 in DGAT1-silenced cell lines was performed at 72 h after transfection with HNF4α1 plasmid. Data are representative of two independent experiments.

