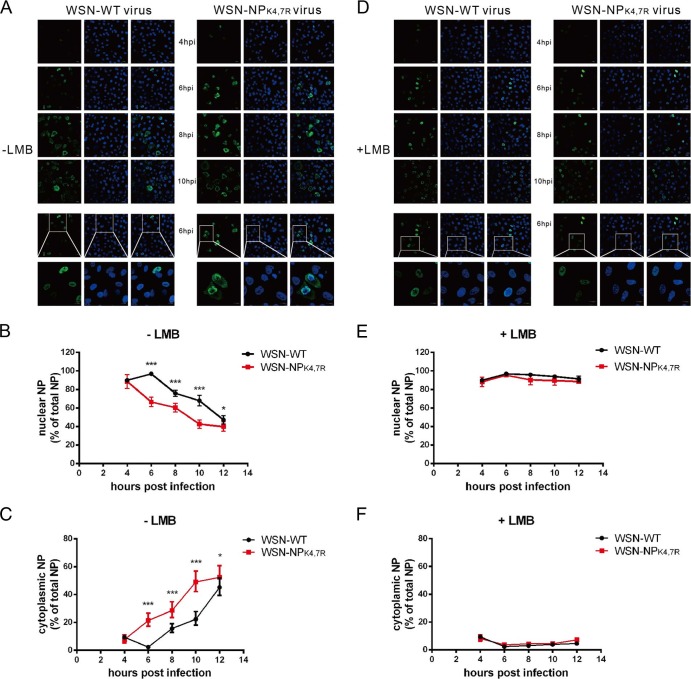
FIG 6.
Sumoylation alters the nuclear transport dynamics of NP. (A) A549 cells were infected with the WSN-WT or WSN-NPK4,7R virus at an MOI of 0.1; the cells were collected and fixed at the times indicated and stained with an anti-NP monoclonal antibody and a goat anti-mouse–Alexa 488 secondary antibody. The nuclei were stained with DAPI. At the very bottom are amplified images taken at 6 h postinfection. The subcellular distribution of NP was quantified by automatic image analysis with the CellProfiler software (35). For each time point, 5 to 10 confocal images were analyzed. The means and 95% confidence intervals of nuclear (B) or cytoplasmic (C) NP fluorescence intensity over the total NP fluorescent intensity from 30 to 100 infected cells are shown. Statistical significance was determined by unpaired Student t tests (*, P < 0.05; ***, P < 0.001). (D) A549 cells were infected with the WSN-WT or WSN-NPK4,7R virus at an MOI of 0.1. At 3 h after infection, the cells were treated with 10 nM LMB and fixed at the times indicated. Staining, imaging, and quantification of nuclear (E) or cytoplasmic (F) NP were performed as described above.

