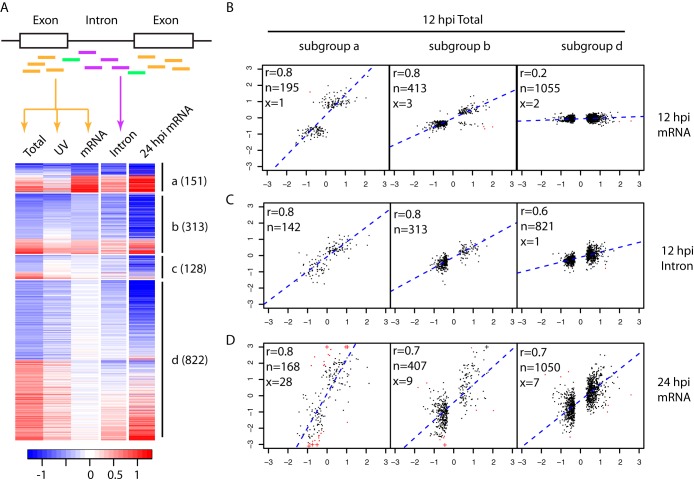
FIG 2.
Comparison of expression changes at 12 hpi measured by Total RNAseq versus mRNAseq. (A) Genes (rows of the heatmap) differentially expressed at 12 hpi were divided into four subgroups (a to d) as described in the text. The numbers of genes in each subgroup are in parentheses. Colors represent log2 infection/mock ratios, blue for downregulation and red for upregulation. The columns are infection/mock ratios for Total RNAseq of HIV infection (Total), Total RNAseq of cells treated with UV-inactivated virions (UV), mRNAseq of HIV infection (mRNA), intronic read counts from Total RNAseq of HIV infection (Intron) at 12 hpi, and mRNAseq of HIV infection at 24 hpi (24 hpi mRNA). To assist the visualization of intronic results, the heatmap shows only 1,414 genes with introns detected (at least 10 reads in at least 3 samples) at 12 hpi by Total RNAseq (Fig. S3 in the supplemental material shows a heatmap with all 1,933 DE genes). The scatterplots of panels B to D are based on the full list of DE genes at 12 hpi. (B to D) Scatterplots between log2 infection/mock ratios by 12 hpi Total RNAseq (x axis) versus that by 12 hpi mRNAseq (B, y axis), intronic read counts from 12 hpi Total RNAseq (C, y axis), and 24 hpi mRNAseq (D, y axis), separately for subgroups a, b, and d. In the top left corner of each scatterplot, the Pearson correlation coefficient (r) and the numbers of genes included in (n, black) or excluded from (x, red) the calculation of correlation are given. The exclusion criterion was a log2 infection/mock ratio difference larger than 4. A log2 infection/mock ratio larger than 3 was truncated to 3 and is indicated with the symbol “+.”

