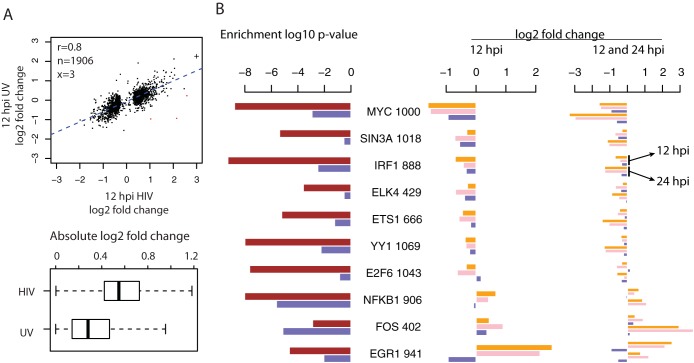
FIG 3.
Comparisons of expression changes induced by intact HIV-1 infection versus treatment with UV-inactivated virions at 12 hpi and enriched TFs. (A) Top, scatterplot of infection/mock ratios in cells infected by intact HIV-1 (x axis) versus treated with UV-inactivated virions (y axis) for 12 hpi DE genes. In the top left corner, the Pearson correlation coefficient (r) and the numbers of genes included in (n, black) or excluded from (x, red) the correlation analysis are given. The exclusion criterion was a log2 infection/mock ratio difference larger than 4. A log2 infection/mock ratio larger than 3 was truncated to 3 and is indicated with the symbol “+.” Bottom, boxplots of the absolute values of log2 ratios shown above. For the boxplot, the whiskers extend to the most extreme data point, which is no more than 1.5 times the interquartile range from the box. (B) Enrichment of TFs in the promoters of DE genes detected in cells infected by intact HIV-1 viruses versus treated by UV-inactivated virions at 12 hpi. Left, enrichment P values of 10 TFs using DE genes separately from HIV-1 infection (brown) and the treatment with UV-inactivated virions (blue) at 12 hpi. Next to each TF name is the number of 12 hpi DE genes with its binding sites. Middle, the log2 infection/mock ratios of enriched TFs at 12 hpi, in the order of mRNAseq, Total RNAseq, and UV-inactivated virions. Right, the log2 infection/mock ratios of enriched TFs at both 12 and 24 hpi, showing that in general the increased changes at 24 hpi during HIV-1 infection were absent in the treatment of UV-inactivated virions.

