
FIG 5.
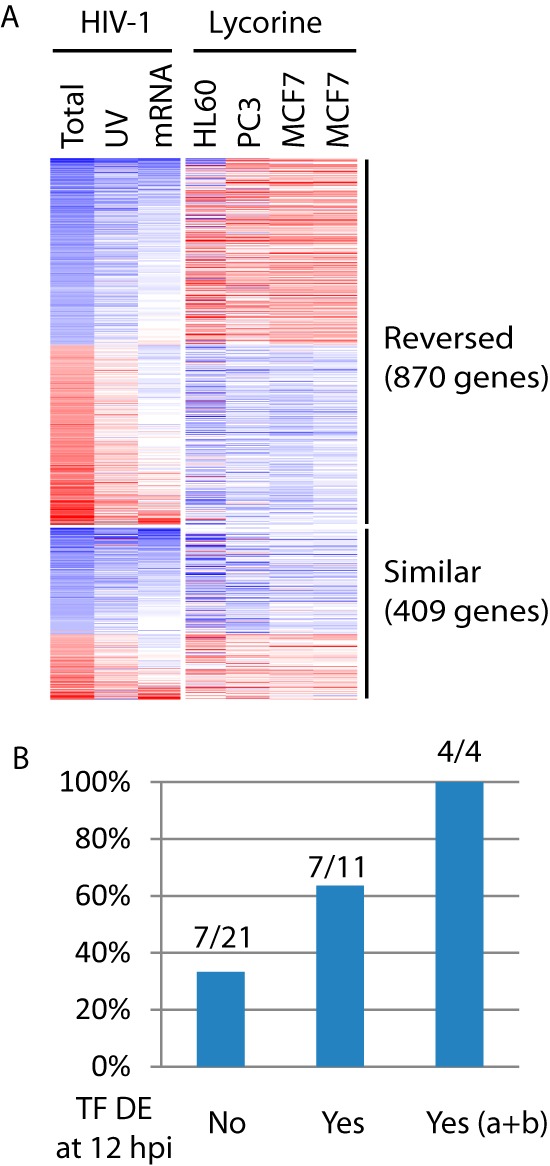
Assessment of TF predictions for HIV-1 infection. (A) Side by side comparison of expression changes induced by HIV-1 infection (12 hpi) or by lycorine treatment. Colors represent log2 infection/mock or treatment/control ratios: blue for downregulation and red for upregulation. Columns represent individual conditions: Total RNAseq of HIV-1 infection (Total) or UV-inactivated virion treatment (UV), mRNAseq of HIV-1 infection (mRNA), and lycorine treatment of three different cell lines (one repeat for MCF7). Lycorine-induced expression profiles were from Connectivity Map. (B) Percentages of 32 identified TFs that themselves had reversed expression changes after lycorine treatment also had targets enriched in genes with reversed expression changes after lycorine treatment. These 32 TFs were grouped into three bins based on their own DE results at 12 hpi: not DE (No), DE (Yes), and DE and subgroups a and b shown in Fig. 2 [Yes (a+b)], which is a subset of DE (Yes).