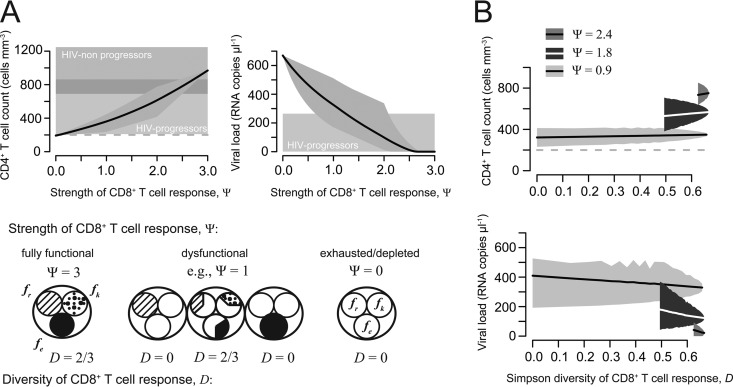
FIG 2.
Strength and diversity of the CD8+ T cell response. (A) CD4+ T cell count and plasma viral load dependent on the strength of the CD8+ T cell response. The gray-shaded areas indicate the minimum and maximum of all calculated values with the corresponding strength (Ψ); the solid line denotes the mean. The horizontally shaded areas indicate the CD4+ T cell count and plasma viral load, as measured for HIV progressors (light gray) and nonprogressors (dark gray) (Table 2). (B) Relationship between the functional diversity of the CD8+ T cell response measured by the Simpson index (D) for the CD4+ T cell count and plasma viral load. All possible combinations of three different Ψ values, 0.9, 1.8, and 2.4, were analyzed separately. Lines denote the mean CD4+ T cell count and plasma viral load, while shaded areas indicate the minimum and maximum of all calculated values with the corresponding diversity index, D.

