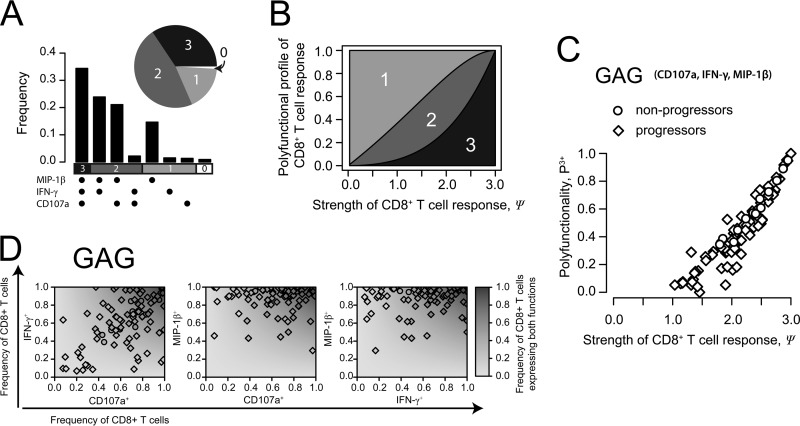
FIG 3.
Strength and polyfunctionality of the CD8+ T cell response. (A) Estimated functionality profile of the CD8+ T cell response for HIV progressors in terms of multifunctionality of single cells based on the measured frequency of individual effector functions, with an fe value of 0.94, an fk value of 0.59, and an fr value of 0.62. (B) Relationship between the strength of the CD8+ T cell response and the multifunctional profile assuming maximal diversity of the response; i.e., fe = fk = fr. (C) Relationship of the strength and the polyfunctionality of the CD8+ T cell response for each patient described previously (12) shown exemplarily for the gag epitope considering three (CD107a, IFN-γ, and MIP-1β) of the five measured effector functions. (D) For each patient described previously (12), the frequency of CD8+ T cells expressing two of the three functions indicated by CD107a, IFN-γ, and MIP-1β (fab) is plotted against the total frequencies of CD8+ T cells expressing the corresponding specific function, i.e., fa and fb. The gray shaded background indicates the profile of the expected frequency of combined expression under the assumption that the particular effector functions are expressed independently (E[fab] = fa × fb). Observations are shown exemplarily for the gag epitope.

