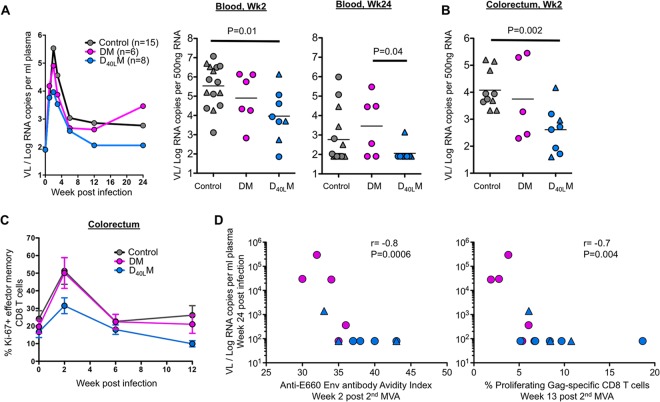
FIG 5.
Postinfection viral load, immune activation, and correlations. (A) Plasma viral load of non-A01+ and A01+ infected animals. (B) Viral RNA copies per 500 ng of total RNA in the colorectum at 2 weeks postinfection. (C) CD8 T cell immune activation in the gut (as measured by Ki67 expression on CD28− CD95+ effector memory CD8). (D) Correlation between viral load at week 24 postinfection and the avidity index against the SIVE660 at 2 weeks after the second MVA or the percentage of proliferating Gag-specific CD8 T cells at week 13 after the second MVA.

