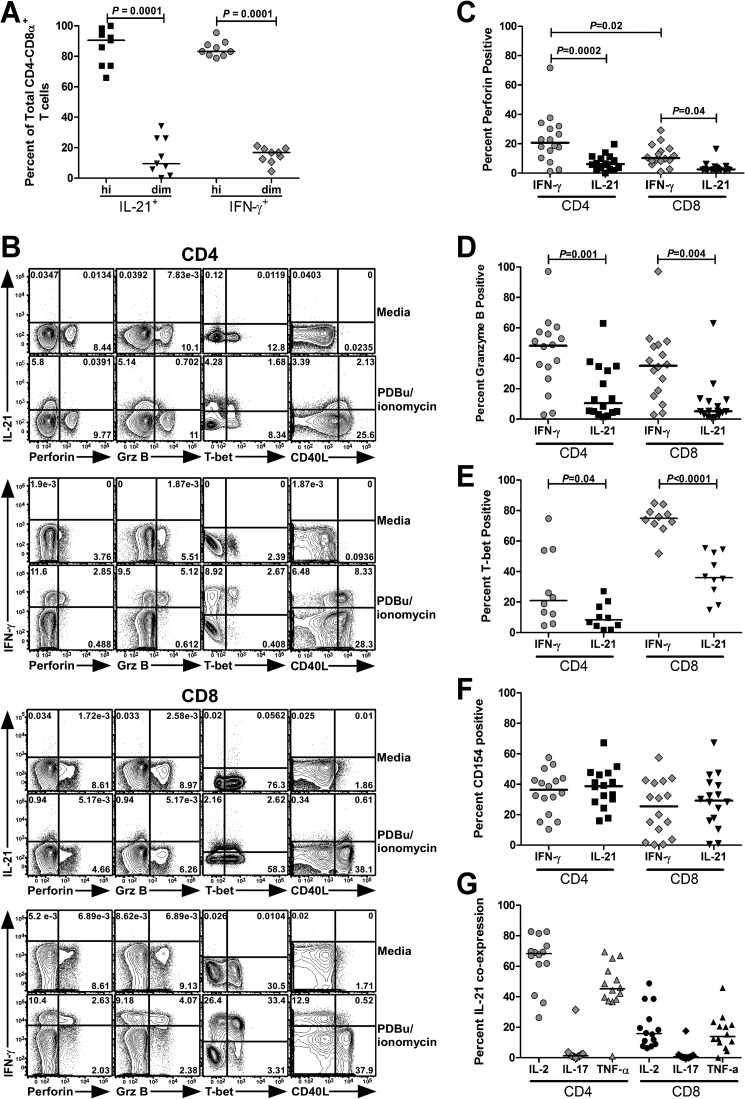
FIG 2.
IL-21-producing CD4− CD8+ T cells exhibit a few characteristics of CD4 T cells. Phenotypic and functional analysis of IL-21-producing T cell populations in HIV-1-infected individuals as determined by flow cytometry. PBMCs were cultured in the presence of anti-CD28/CD49d, GolgiStop, and GolgiPlug, polyclonally activated with PDBu/ionomycin for 5 h, and subsequently stained with fluorochrome-conjugated monoclonal antibodies (MAbs) against IL-21 (clone 3A3.N21) and IFN-γ (clone B27). Cells were then gated on live CD3+ CD4− lymphocytes and analyzed for high (“hi”) or low (“dim”) expression of the CD8α chain (clone RPA-T8). Data are expressed as the percentage of total IL-21+ or IFN-γ+ CD4− CD8α+ T cells (A). Panels B to F contain representative flow cytometric plots (B) and compilation graphs showing the percentages of total IL-21+ or IFN-γ+ CD8− CD4+ and CD4− CD8+ T cells that expressed perforin (clone BD48) (C), granzyme B (GrzB) (clone GB11) (D), T-bet (clone 4B10) (E), or upregulated CD40L (clone TRAP-1) (F). For assessment of CD40L expression, cells were cocultured with CD154 MAb in the presence of GolgiStop. The percentages of total IL-21-producing CD4 and CD8 T cells that coexpressed IL-2 (clone MQ1-17H12), IL-17 (clone N49-653), or TNF-α (clone MAb11) are also shown (G). Statistical significance was determined using the two-tailed Mann-Whitney U test; horizontal bars represent median.

