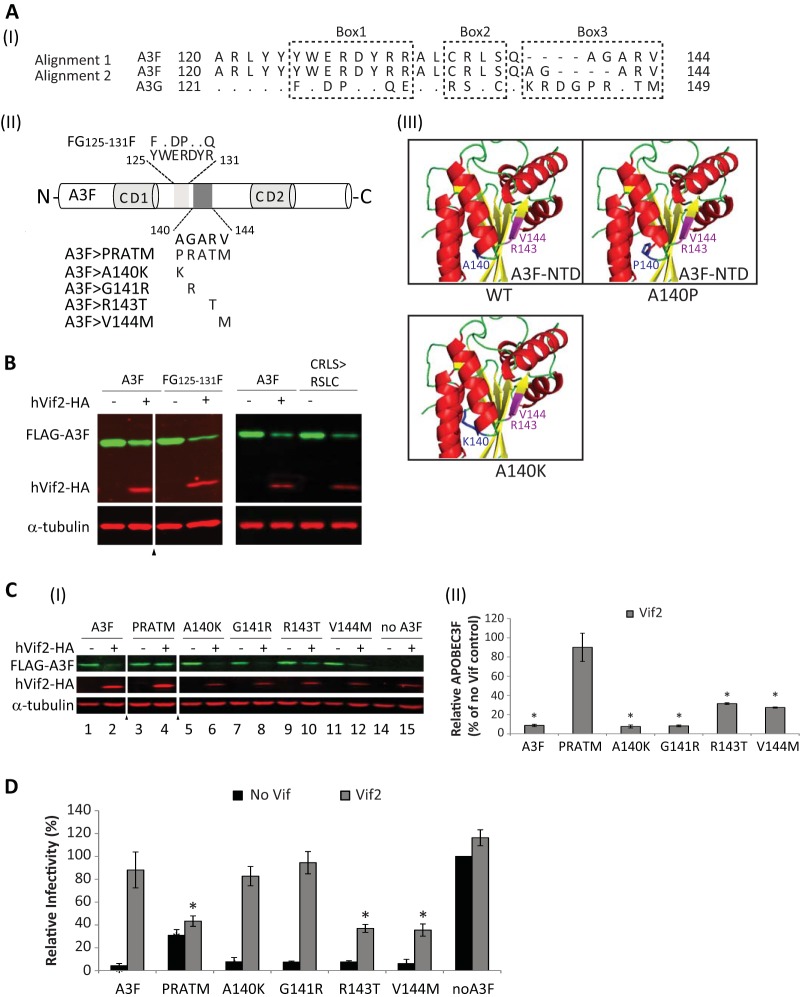
FIG 8.
Identification of a determinant in A3F that confers sensitivity to Vif2. (AI) Two alignments of A3F amino acids 120 to 144 with the corresponding amino acids in A3G are shown. Dots, identical amino acids; dashes, gaps; box 1, box 2, and box 3, regions that contain significant differences between A3F and A3G. (AII) Schematics of A3F, the box1 amino acids 125YWERDYR131 (light shaded box) and mutant FG125-131F, and box 3 amino acids 140AGARV144 (dark shaded box) and mutants PRATM, A140K, G141R, R143T, and V144M are shown. (AIII) The predicted structure for A3F N-terminal amino acids 1 to 189 was simulated by the SwissModel server using the APOBEC3C crystal structure as a template (73). The model shows that replacement of A140 with a proline, but not a lysine, results in shortening of helix 4. Amino acids R143 and V144, shown in fuchsia, are predicted to be part of β-sheet 5. (B) Sensitivity of FG125-131F and CRLS>RSLC mutants to Vif2-mediated degradation. Quantitative Western blot analyses of cell lysates were performed by using an anti-FLAG antibody to detect FLAG-A3F, FG125-131F, or the A3F CRLS>RSLC mutant, an anti-HA antibody to detect hVif2-HA, and an anti-α-tubulin antibody to detect α-tubulin. Lanes +, with Vif2; lanes −, without Vif2; triangle, lanes derived from the same blot with extraneous lanes were removed. (CI) Sensitivity of A3F box 3 mutants to Vif2-mediated degradation. Quantitative Western blots were performed as described in the legend to panel B. (CII) Quantitation of the amount of A3F remaining relative to the amount for the no-Vif2 control. The error bars indicate standard deviations from three independent experiments. (D) hVif2-HA rescue of HIV-1 ΔVif infectivity in the presence of A3F and its mutants. Viruses were produced and infectivity was determined as described in the legend to Fig. 2. Data are plotted as relative infectivity levels, with the level in the absence of any A3 protein being set equal to 100%. Error bars indicate standard errors of the means (SEMs) of the results from three independent experiments. A P value of <0.05 was considered statistically significant (*).

