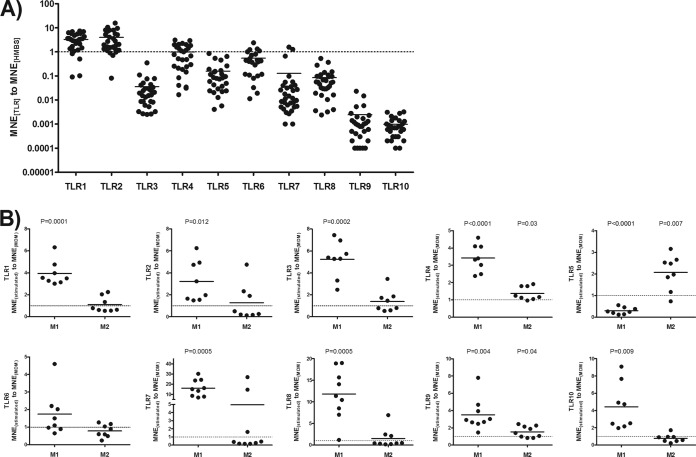
FIG 2.
TLR mRNA expression pattern in MDMs and M1- and M2-polarized macrophages. (A) MDMs were generated by culturing highly purified monocytes over 1 week. MDMs (106) were harvested, and RNA was extracted for quantifying the TLRs by real-time PCR. Data are presented as the ratio of the MNE of the distinct TLRs to the MNE of HMBS. (B) TLR expression level of M1- and M2-polarized macrophages in relation to that for matched MDMs. The levels of TLR expression of polarized macrophages were compared to those of unstimulated MDMs by a paired t test with a two-tailed P value.

