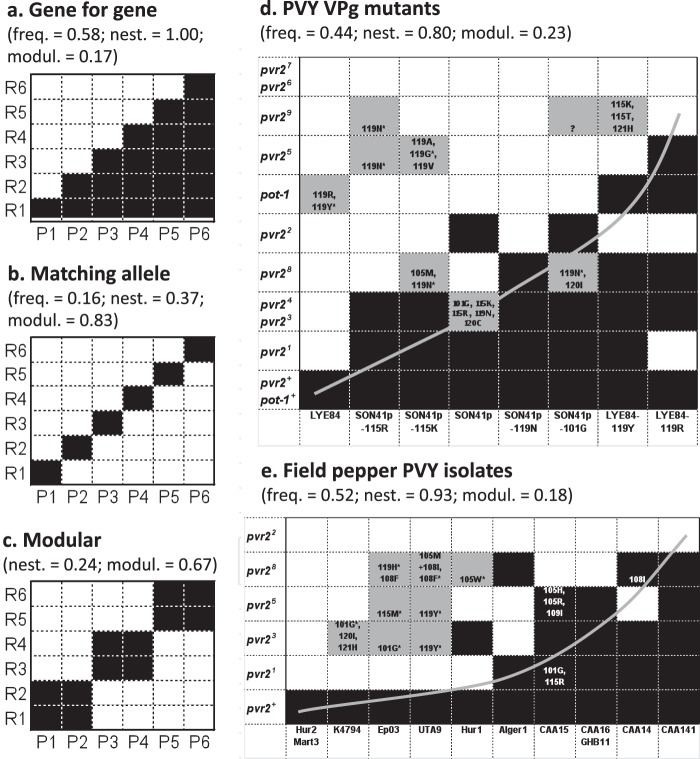
FIG 1.
Interaction matrices between host and parasite genotypes. (a to c) Three theoretical interaction matrices between host genotypes carrying different resistance genes or alleles (R1 to R6) and parasite pathotypes (P1 to P6). Black boxes indicate infection of the host with the indicated genotype by the parasite with the indicated genotype, and white boxes indicate lack of infection. (d and e) Experimental interaction matrices between PVY variants (columns) and plants of Capsicum annuum or Solanum habrochaites with genotypes (rows) carrying different alleles at the pvr2 or pot-1 locus, respectively. Black boxes indicate infection of 100% of inoculated plants, whereas white boxes indicate no infection. Gray boxes indicate <100% infection and occurrence of additional mutations in the VPg pathogenicity factor. Amino acid substitutions observed in the VPg of the viral progeny are indicated within boxes. The question mark indicates that a single plant was infected, and no sequence was obtained for the VPg-coding region. Asterisks indicate PVY populations, almost all of which show secondary mutations in the VPg-coding region, that were chosen for back-inoculation in the same plant genotype. For all of them, all (25 of 25) back-inoculated plants were infected 15 days after inoculation. These matrices differ by the frequency of compatibility (infection) cases (freq) and the nestedness (nest; estimated with the algorithm of Rodríguez-Gironés and Santamaría [19]) and modularity (modul; estimated with an exhaustive search algorithm) of these compatibility cases. The rows and columns of matrices shown in panels d and e were ordered to evidence the significant nested pattern (gray curve) (Table 1). No frequency of compatibility cases is indicated for the modular model because it depends greatly on the size of modules.

