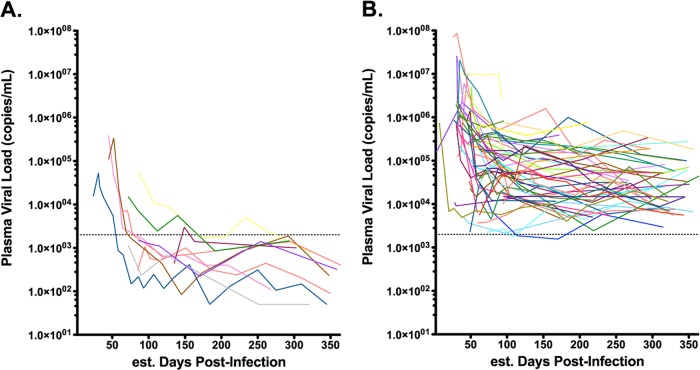
FIG 1.
Plasma viral loads of AC and AP during the first year postinfection. Lines illustrate the plasma viral load (in HIV RNA copies/ml) for each participant. (A) Data are plotted for 10 AC who achieved viremic control (<2,000 RNA copies/ml) within the first year of infection. (B) Data are plotted for 50 AP who did not control viremia during this time. Dashed lines indicate the threshold value (2,000 RNA copies/ml) used to identify acute controllers.

