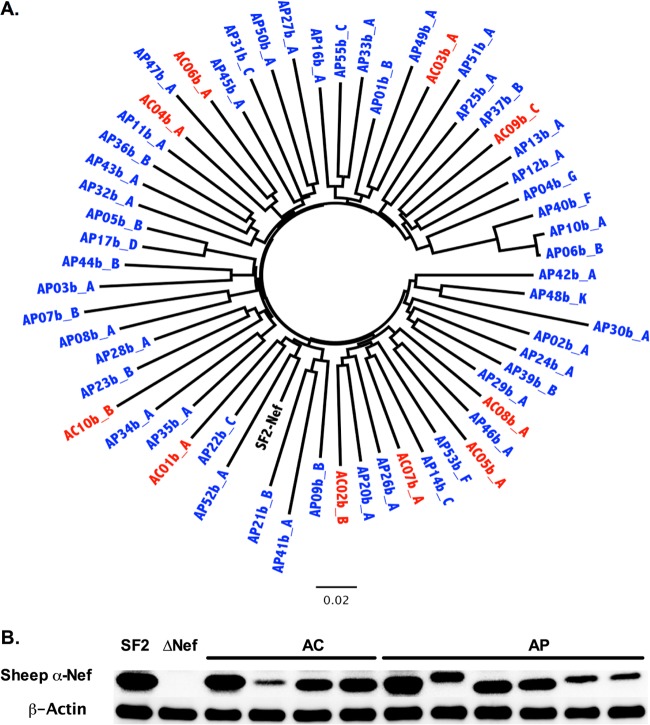
FIG 2.
Nef sequences from AC and AP display no substantial phylogenetic clustering. (A) An unrooted maximum-likelihood phylogenetic tree depicts the representative Nef clone isolated from 10 AC (red) and 50 AP (blue), indicating that sequences did not exhibit substantial clustering by cohort. The HIV-1SF2 Nef sequence (black) is included for comparison. A phylogenetic tree that includes all clonal Nef sequences used for this study is shown in Fig. S1 in the supplemental material. (B) Western blot analysis was used to examine steady-state protein levels in AC and AP Nef clones, along with NefSF2 (positive control) and ΔNef (negative control). β-Actin was used as a cellular protein control.

