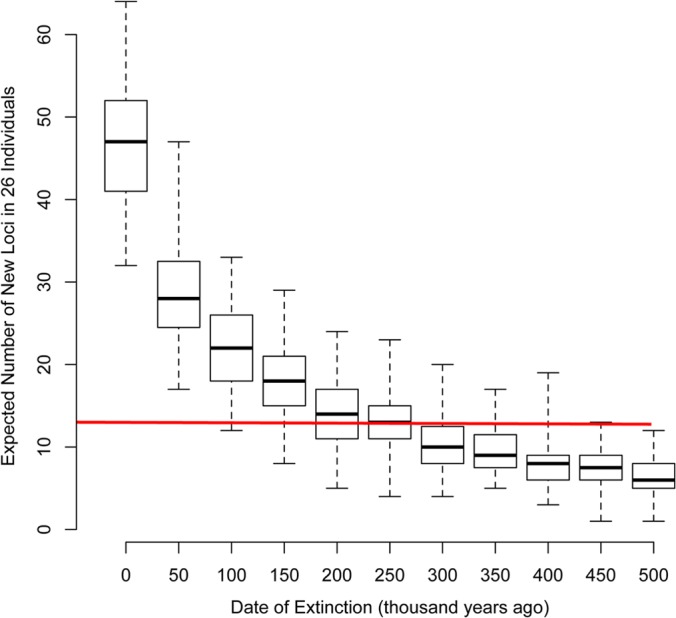
FIG 4.

Comparison of the observed and expected numbers of loci. The number of loci in the 26 TCGA patients predicted by the genetic drift model is shown. Along the x axis are the expectations assuming either that the rate of copying until the present day is constant (the date of extinction is year 0) or that the copying of loci ceased at different dates in the last half million years. The red line across the figure shows the observed number (n = 13). The boxes show the medians, interquartile ranges, and the most extreme values from 10,000 replicates.
