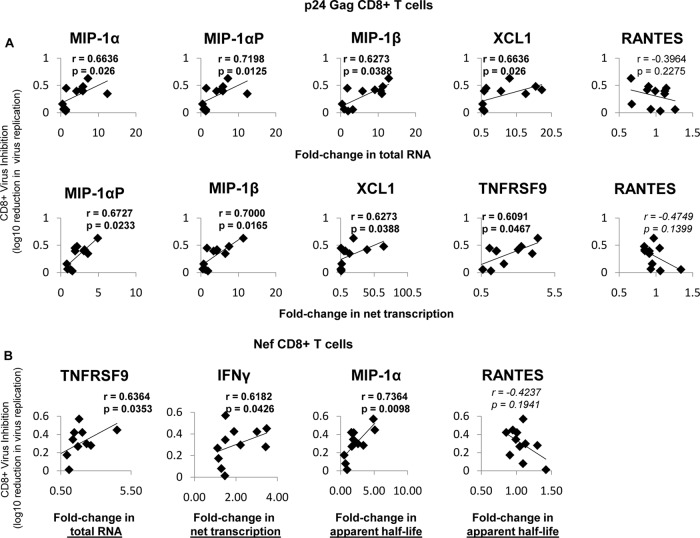
FIG 6.
Virus inhibition correlates with changes in total RNA, net transcription, and apparent half-life. (A) Fold changes in p24-stimulated cells that significantly correlated with virus inhibition. (Top row) In p24-stimulated cells, the fold changes (compared to unstimulated cells) in mRNA abundances of MIP1α, MIP1α-AP, MIP1β, and XCL1 correlated with soluble virus inhibition (measured as log10 reduction in virus replication), while RANTES did not. mRNA abundance was determined via primer-specific PCR. (Bottom row) Fold changes (p24 stimulated/unstimulated) in net transcription of MIP1α-AP, MIP1β, XCL1, and TNFRSF9 correlate with soluble inhibition, while RANTES again does not. The rate of transcription was determined by primer-specific PCR of 4sU-labeled RNA (described in Materials and Methods). (B) Fold changes in Nef-stimulated cells that correlate with virus inhibition. In Nef-stimulated cells, the fold change (compared to unstimulated cells) in the mRNA abundance of TNFRSF9, net transcription of IFN-γ, and apparent half-life of MIP1α correlates with soluble virus inhibition (measured as log10 reduction in virus replication), while RANTES does not. The log10 reduction in virus replication was determined via sVIA, as described in Materials and Methods. The r values were calculated using Spearman correlation. Trendlines are shown.

