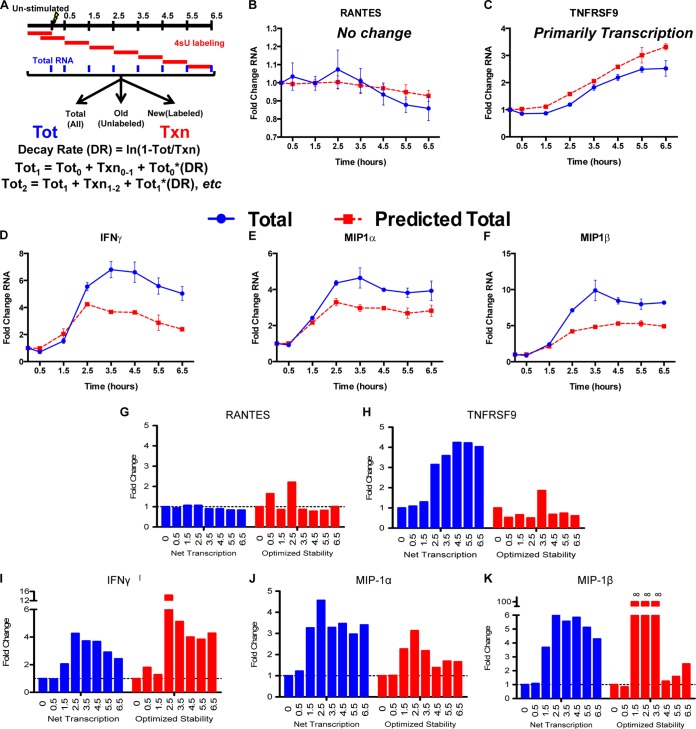
FIG 7.
Temporal expression of antiviral cytokines is quicker and more robust in CD8+ T cells with higher RNA stability. (A) Diagram of time course experiments. Cells were labeled with 4sU for 1-h segments after stimulation for 6.5 h with p24 peptide, and then the RNA was separated to measure the net transcription. The levels of total mRNA were predicted using a prestimulation total, net transcription over each hour-long time period, and the prestimulation decay rate. These predictions were then compared to observed total mRNA abundances. (B and C) For unchanged (RANTES) (B) or transcriptionally induced (TNFRSF9) (C) genes, the model (red lines) accurately predicted the observed levels of mRNA abundance (blue lines). (D to F) For IFN-γ (D), MIP-1α (E), and MIP-1β (F), however, the levels of total mRNA observed were much greater than a constant decay rate predicted. (G to K) We calculated optimized mRNA stabilities based on the observed mRNA totals using the following formula: DRoptimized = (Ti − 1 + Ni − Ti)/−Ti − 1, where Ti is the measured total mRNA at time i and Ni is the measured net transcription at time i. The optimized stability of mRNA increased in coordination with increases in net transcription, so that mRNAs underwent a “peaked” stability response that correlated with the transcriptional induction. Error bars indicate standard error.

