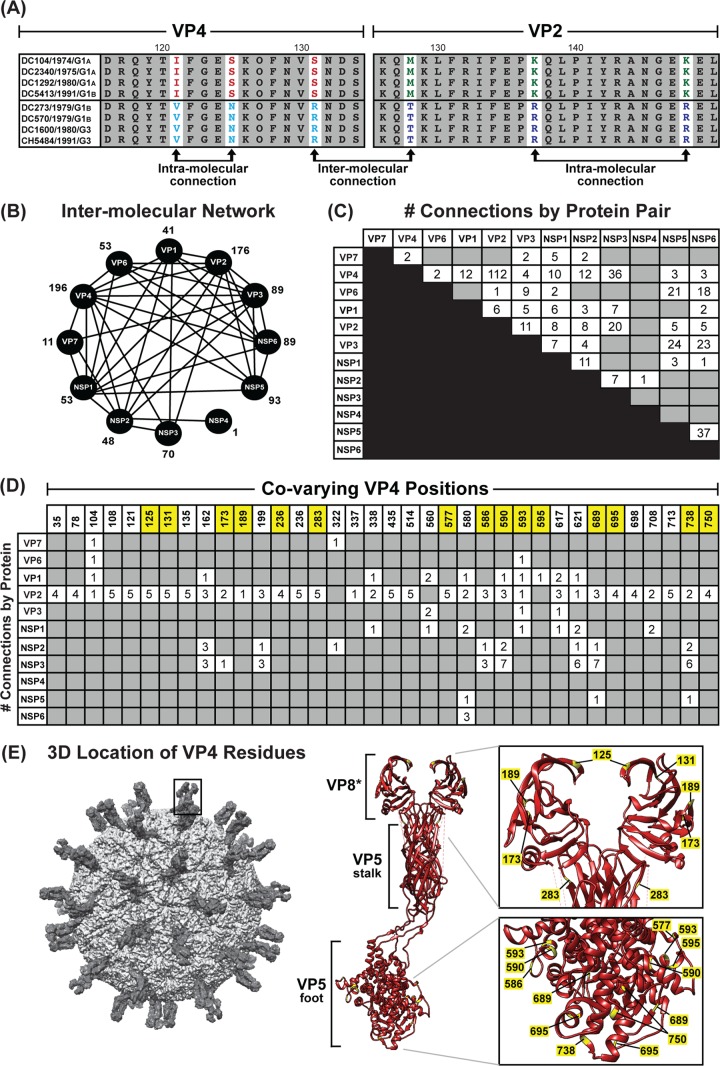
FIG 9.
Amino acid covariation among DC RV proteins. (A) Schematic showing an example of correlated amino acid changes within (intramolecular connections) and between (intermolecular connection) two different viral proteins (VP4 residues 116 to 131 versus VP2 residues 126 to 150). (B) Intermolecular covariation network. Each viral protein is represented by a black circle. Lines connecting the circles indicate that the two proteins showed intermolecularly covarying amino acid positions with mutual information scores of >64.9. The total number of intermolecular connections made by each protein is shown next to the circle. (C) Matrix showing the number of intermolecular connections for each protein pair with mutual information scores of >64.9. The gray boxes indicate that no connections were found. (D) Matrix showing the covarying amino acid positions of VP4 and the number of connections each position makes with another viral protein. VP4 positions highlighted in yellow have codons with dN/dS ratios of >1. (E) The RV virion is shown on the far left, with a VP4 spike outlined. The atomic structure of VP4 is shown in ribbon representation (PDB number 3IYU) in the middle, with VP8* and VP5 stalk/foot subdomains labeled. Residues in yellow are those from panel C. A magnified view of the VP8* and VP5 foot subdomains is shown on the right, with the positions of amino acids labeled.

