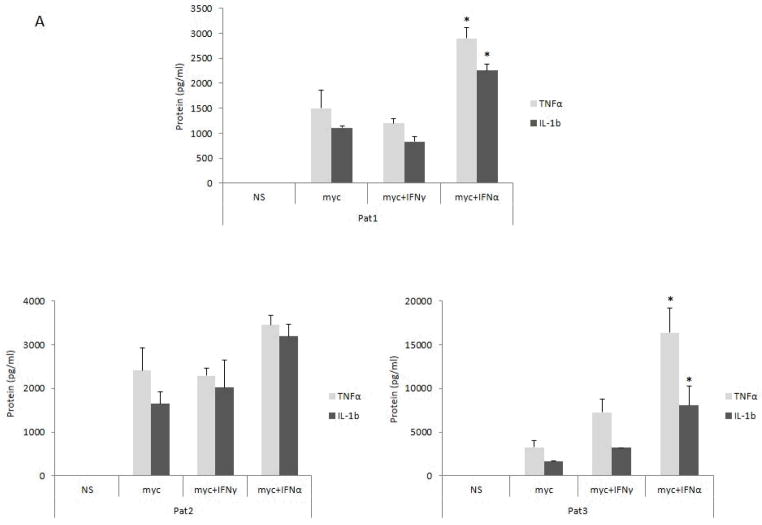
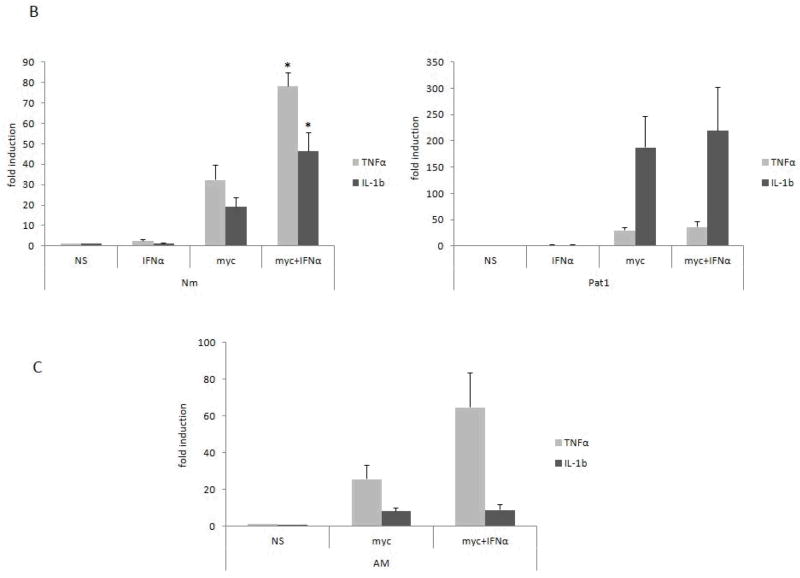
Figure 5. Gene expression following mycobacterial stimulation.
(a) MDM obtained from patients were stimulated with mycobacteria (myc = M. avium, MOI 5) and IFN-α (1,000 IU/ml) added simultaneously to the wells. Supernatant levels (pg/ml) of TNF-α and IL-1β were assayed 20 h after culture stimulation; (b) Gene expression was evaluated in MDM 3 h after stimulation; (c) Alveolar macrophages (AM) obtained from normal donors were plated, stimulated and assayed as above. Results are mean ± SD of three independent experiments. *p<0.05 when compared to cells stimulated with mycobacteria alone.


