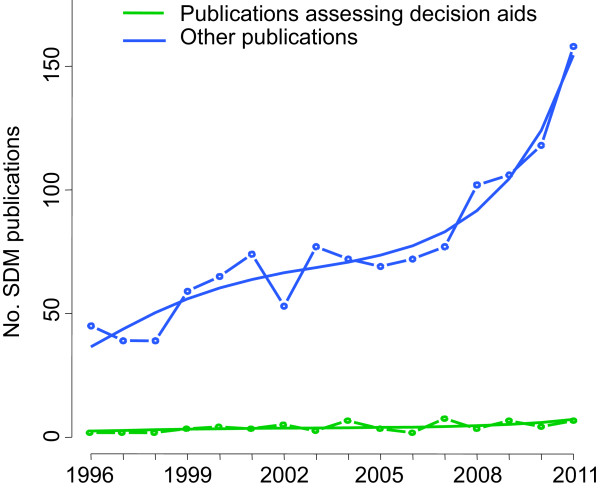
Figure 5.

Absolute numbers of SDM publications over time and publications assessing decision aids. The curve was estimated in a Poisson model; with the number of other publications in a year and the number of publications assessing decision aids in a year as dependent variables (N0 and N1, respectively) and year since 1996 as an independent variable (t). N0 = exp(3.60 + 0.21 ∗ t - 0.02 ∗ t2 + 0.001 ∗ t3). N1 = exp(0.58 + 0.21 ∗ t - 0.02 ∗ t2 + 0.001 ∗ t3). All coefficients P < 0.01.
