Figure 1.

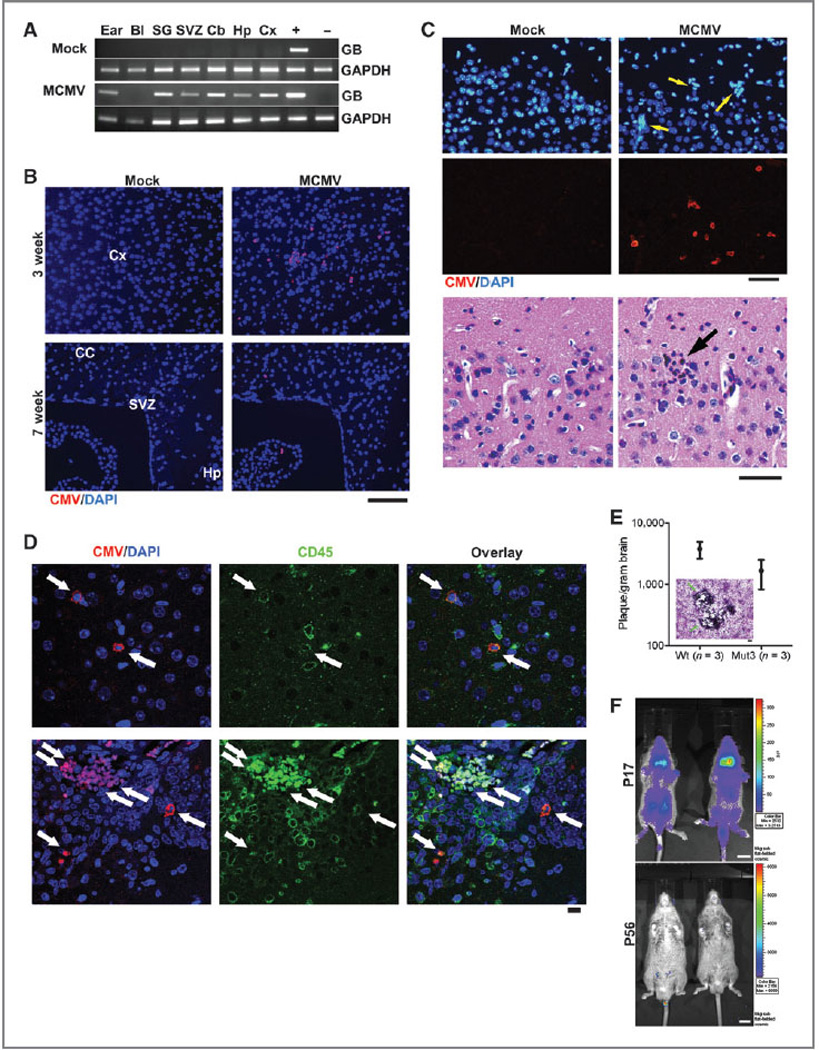
Perinatal MCMV infection resulted in productive virus replication and CMV immunoreactivity in CD45-positive cells in the brain. A, PCR analysis for MCMV glycoprotein B (GB) gene in genomic DNA obtained from PBS-perfused mock-versus MCMV-infected, 8-week-old mice. Representative data from n = 3 per group are shown. Bl, blood; SG, salivary gland; Cb, cerebellum; Hp, hippocampus; Cx, cortex. + and −, gDNA from MCMV-infected and -negative cells, respectively. B, IHC data for CMV in the brains of mock-versus MCMV-infected mice. Representative data from n = 3 per group are shown. Cx, cortex; CC, corpus callosum; Hp, hippocampus. Scale bar, 100 mm. C, top, IHC images show ectopic cellularity (blue, arrows) close to CMV-positive cells (red) in the cortex of 3-week-old wt mice infected with MCMV at P2, which were absent in mock-infected mice. Bottom, hematoxylin and eosin-stained brain sections adjacent to the sections in top images contained an inflammatory focus (arrow) in the MCMV mice, which was absent in mock-infected mice. Representative data from n = 3 per group are shown. In brain sections containing both the dentate gyrus and SVZ, 3.67 × 1.45 (mean ± SEM) of inflammatory foci were detected per section. Scale bars, 50 mm. D, confocal images of IHC for CMV and CD45 display immunoreactivity in the brains from 2-week-old wt mice. Cells double-positive for both CMV and CD45 are noted by arrows. Representative data from n = 7–8 images on n = 3 brains per group are shown. Scale bar, 10 mm. E, brain extract of 2-week-old mice infected with MCMV formed virus-induced plaques in 3T3 cells. There was no significant difference between wt and Mut3 (P = 0.16). Error bars indicate SEM. Inset, a representative image of plaque formation (arrows) in 3T3 cells. Scale bar, 100 mm. No plaque was formed by brain extract of mock-infected mice (n = 3 per group, not shown). F, bioluminescent live imaging on P17 and adult (P56) mice infected with MCMV-luciferase. Representative data from n = 3 per group are shown. Scale bar, 1 cm.
