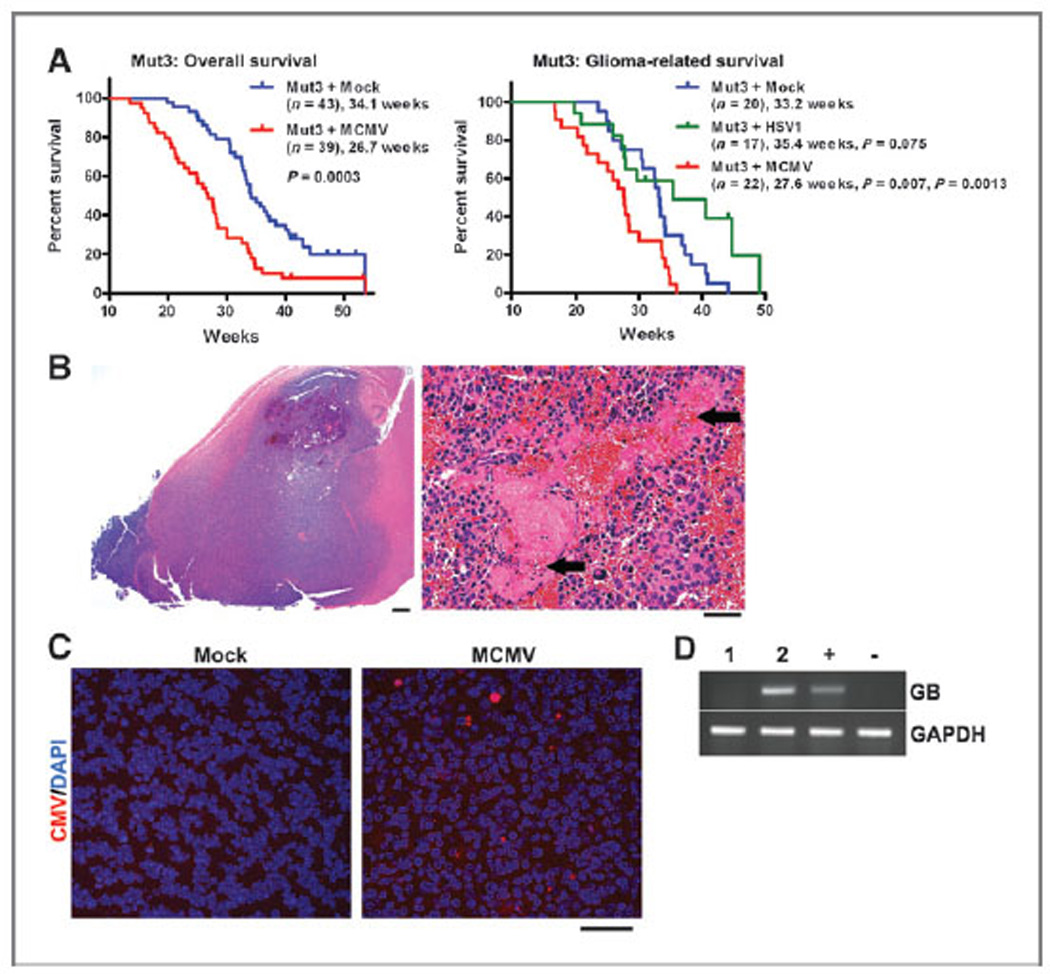
Figure 2.

Perinatal MCMV infection shortens the survival of Mut3 mice. A, Kaplan–Meier curves display overall (left) and histologically confirmed glioma (right) survivals of Mut3 mice. Labels indicate infection groups, mouse numbers, mean survival time, and P values against mock and HSV1 (first and second P values, respectively). B, left, a representative hematoxylin and eosin-stained brain section from an MCMV-infected Mut3 mouse that harbored a grade IV astrocytoma (glioblastoma) spreading extensively throughout the forebrain. Scale bar, 500 mm. Right, a higher magnification image from the same tumor displaying extensive necrosis (arrows). Scale bar, 50 mm. C, IHC images for CMV in gliomas from mock-versus MCMV-infected Mut3 mice. Representative data from n = 4 per group are shown. About 41.3 × 16.2 of CMV-positive cells (mean ± SEM) were detected per nm2 of randomly chosen tumor field (n = 4) in gliomas from MCMV-infected Mut3 mice, but none from gliomas from mock-infected Mut3 mice. Scale bar, 50 mm. D, RT-PCR analysis for MCMV glycoprotein B (GB) in gliomas from mock- (1) versus MCMV-infected (2) Mut3 mice (n = 1). + and −, MCMV-infected and -negative cells, respectively.
