
Figure 4.
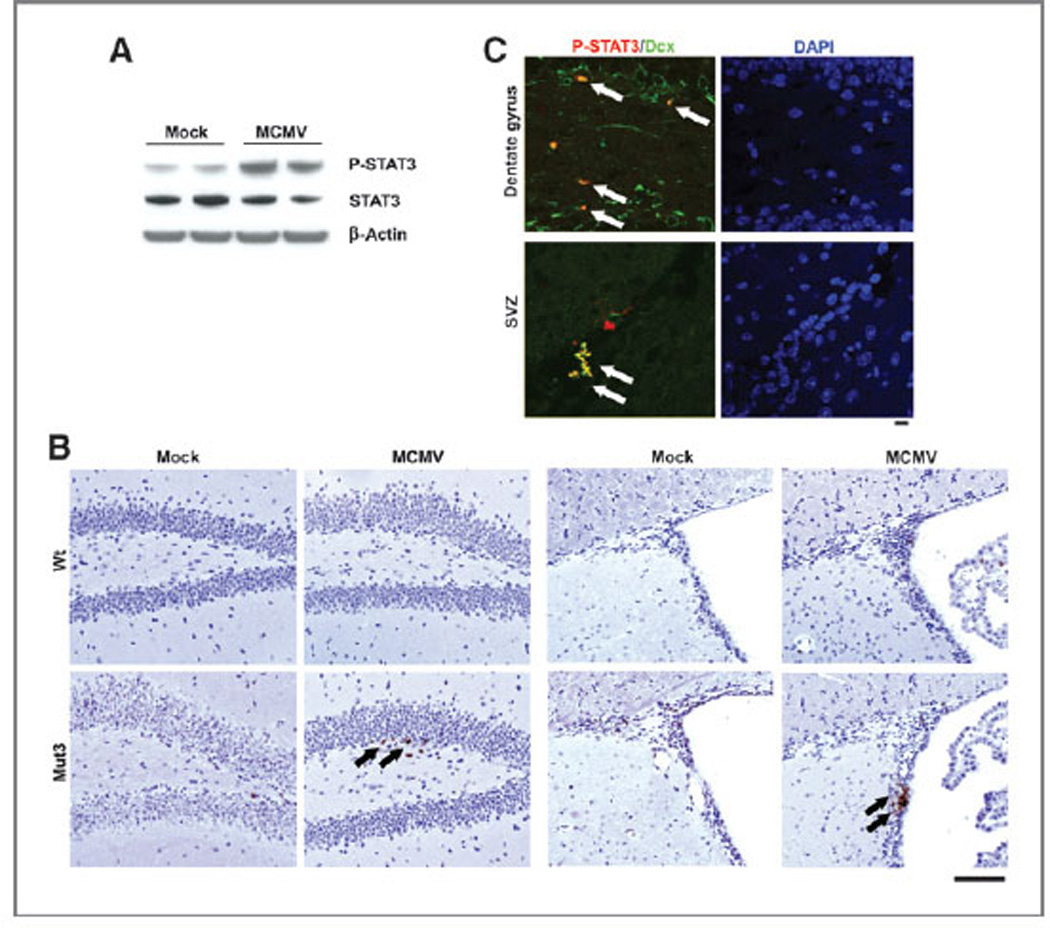
p-STAT3 in NSCs in MCMV-infected Mut3 brains. A, p-STAT3, STAT3, and β-actin Western blotting using NSC cultures derived from the SVZ of 4-week-old Mut3 mice. The cultures were infected with MOI of 1.0 of MCMV and incubated for 2 days. Representative data from n = 4 per group are shown. Densitometric scanning reveals 2.75-fold more p-STAT3/β-actin ratio in MCMV than in mock samples. B, p-STAT3 IHC staining (arrows) in the dentate gyrus SGZ (left) and SVZ (right) of 7-week-old mock-versus MCMV-infected wt or Mut3 mice. Representative data from n = 3 per group are shown. Scale bar, 100 mm. C, confocal images of IHC for p-STAT3 and Dcx in the brain of 7-week-old MCMV-infected Mut3 mice. Dually immunoreactive cells are labeled with arrows. Representative data from n = 3 per group are shown. Scale bar, 10 mm.