
Fig. 1.
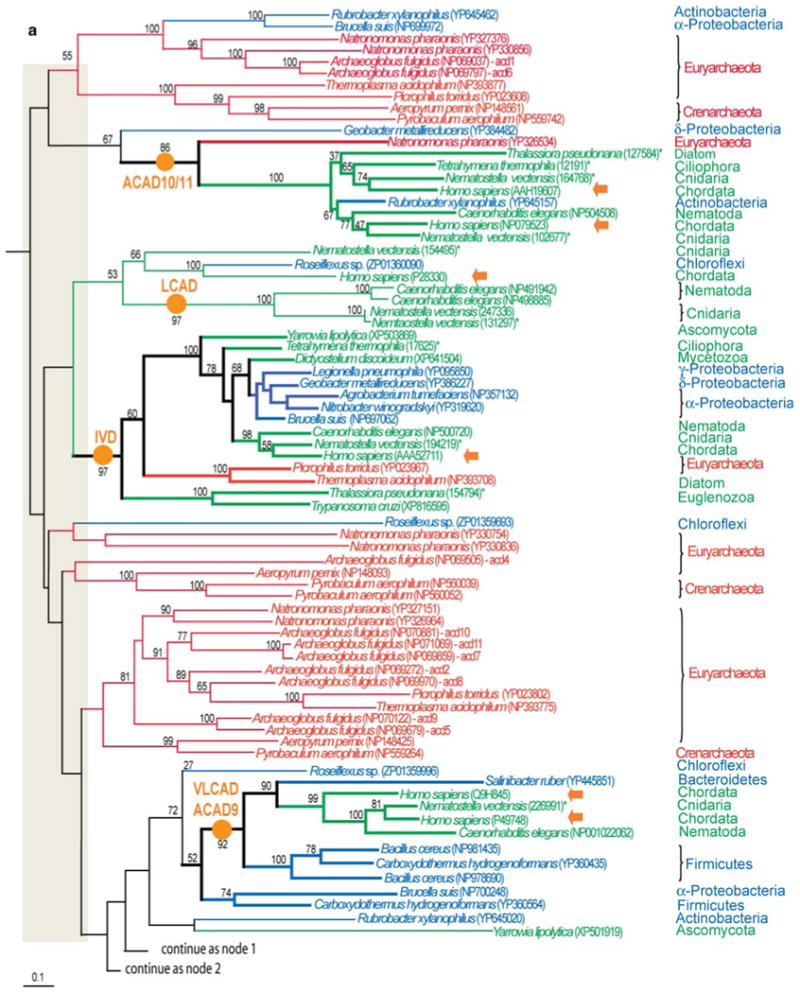
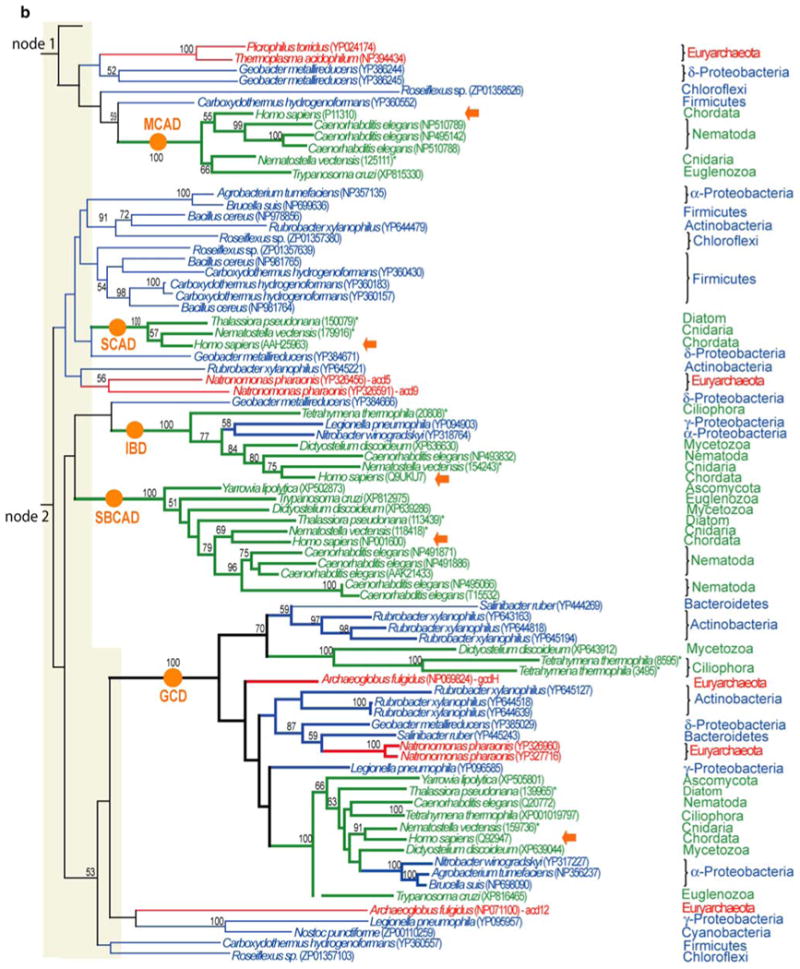
Maximum likelihood phylogeny of acyl-CoA dehydrogenase protein family. Maximum likelihood phylogeny was estimated from a dataset of 353 amino acid positions from 205 sequences using PHYML (Guindon and Gascuel 2003). Tree was rooted (R) with ACOX and aidB homologs (not shown). Numbers at internodes refer to maximum likelihood bootstrap values. Only bootstrap values of >50% are shown. Gray bar shows the basal tree topology that differed in various analyses and exhibited low bootstrap support (<50%). Thick branches represent well-supported clades corresponding to human ACAD species (marked by circles) that were consistently recovered in all analyses performed. Arrows point to human ACAD homologs. Sequence accession numbers are in parentheses