
Fig. 2.
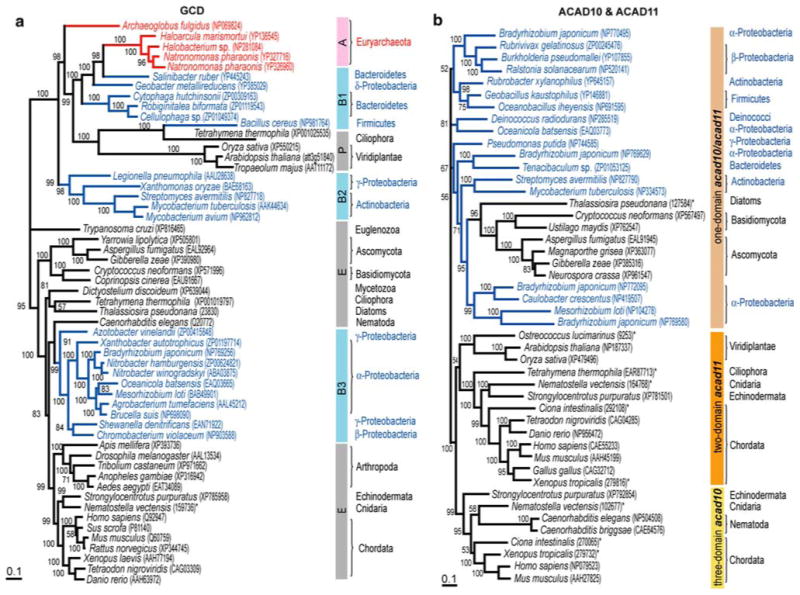
Bayesian phylogeny of glutaryl-CoA dehydrogenase (a) and ACAD10/11 (b) protein subfamilies. Unrooted phylograms were estimated from 377 and 402 amino acids, respectively. Numbers at internodes show posterior probabilities for Bayesian consensus tree. Bars (right to a) refer to clades or groups: A = archaeal taxa, B1–B3 = bacterial taxa, P and E = eukaryotic taxa