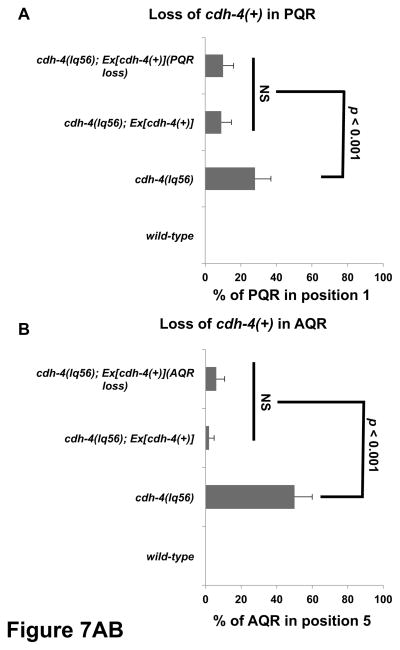
Figure 7. Quantification of AQR and PQR migration in cdh-4 genetic mosaics.
Graphs plot the percentage of AQR or PQR migration defects (Y-axis) in different genotypes (X-axis). Error bars represent 2x SEP, and at least 100 animals of each genotype were scored. Statistical significance was determined by Fisher’s exact test. A) PQR migration defects in animals that lost the rescuing cdh-4::gfp array in PQR (PQR loss) but retained the array in AQR and URX L/R. Animals with and without the array in PQR showed reduced defects compared to cdh-4(lq56) alone that were not significantly different from one another. B) AQR migration defects in animals that lost the array in AQR (AQR loss) but retained it in PQR and URX L/R. Animals with and without the array in AQR showed reduced defects compared to cdh-4(lq56) alone that were not significantly different from one another.

