
Figure 3. LVEF at baseline and at 6 months for men, peripartum cardiomyopathy (PPCM) women and non-PPCM women.
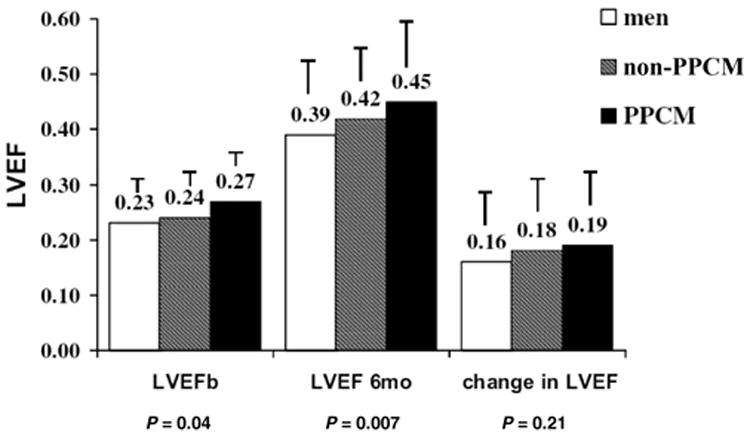
Label on each bar represents the mean left ventricular ejection fraction (LVEF) for the subset ±standard deviation. LVEF was significantly greater in PPCM women at baseline (p = 0.04) and at 6 months (p = 0.007). Men at all points had the lowest LVEF, while non-PPCM women had intermediate LVEF levels. Reproduced with permission from Cooper et al. 2012 (7).