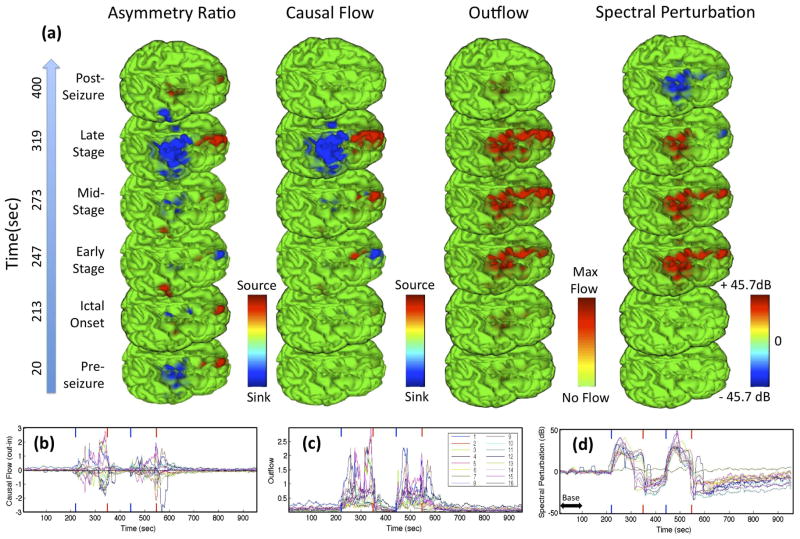
Fig. 3.
Panel (a) shows a sequence of frames from animations mapping 4–30 Hz causal and spectral measures projected onto the cortical surface before, after and during different stages of the first seizure. Colormaps bounded at 99th percentile. Panels (b–d) show, respectively, the causal flow, outflow, and spectral perturbation (deviation from 1–100 second baseline power indicated by horizontal doublearrow) for all IC sources as a function of time. Blue (Red) vertical ticks denote onset (offset) of both seizures. High resolution version of this and other images available at [18].

