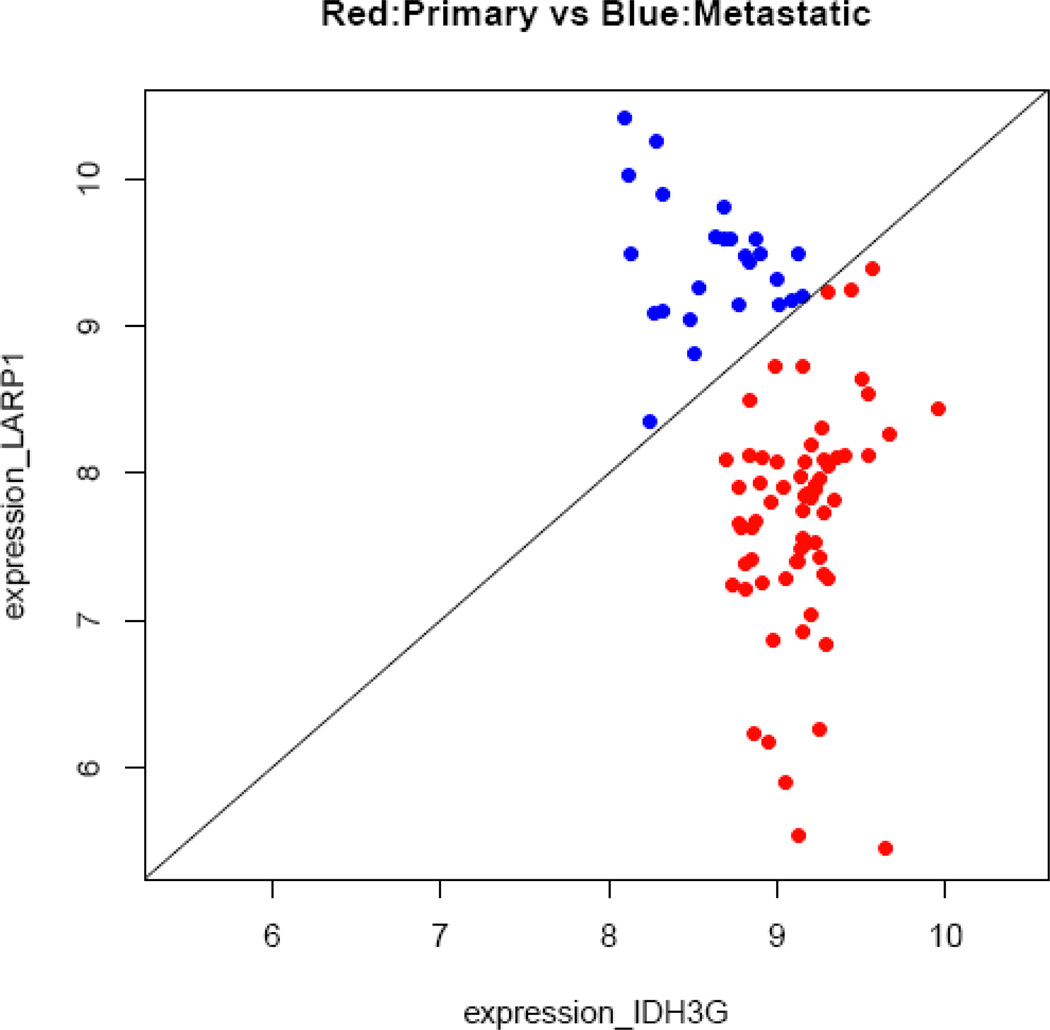
Figure 4.
Classification plot for discrimination between primary tumors and distant metastasis, using data from Chandran et al.5 This exemplary pair of genes, IDH3G/LARP1, has 100% sensitivity and 100% specificity. The x axis represents the log-expression value of IDH3G, and the y axis is that of LARP1.

