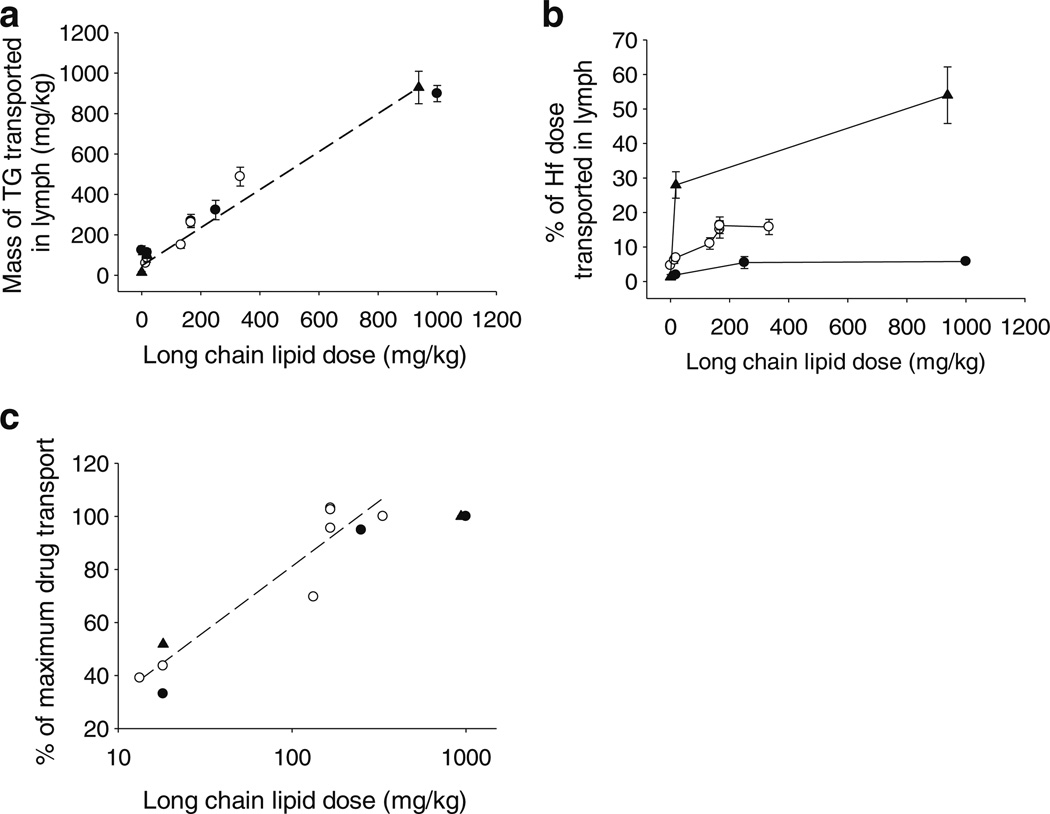
Fig. 6.
(a) Mass of triglyceride (TG) transported into lymph over 8 h (mg/kg), (b) % of the halofantrine (Hf) dose transported into lymph over 8 h, and (c) % of the maximum drug transport achieved in each species versus the mass of long chain lipid (mg/ kg) with which halofantrine was administered to lymph-duct cannulated mice (black circle), rats (white circle) or dogs (black triangle). Data represent mean ± SEM, n=3–5 per group. Rat data from the current study and previous rat (20,21,26–28) and dog data (9,29) from referenced publications included.

