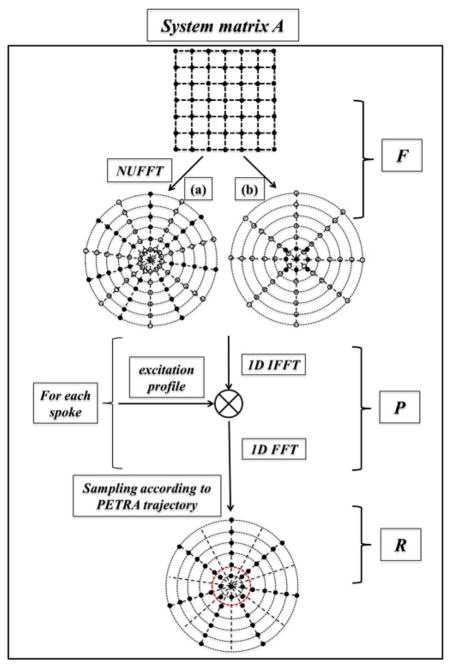
Fig. 2.
Diagram of the implementation of the system matrix A, composed of three sequential operators: the NUFFT operator F, the excitation profile modulation operator P and the sampling operator R. The solid dots in a) and b) represent the acquired samples in k-space and the hollow circles denote the locations which are interpolated by NUFFT but not acquired by the sequence.

