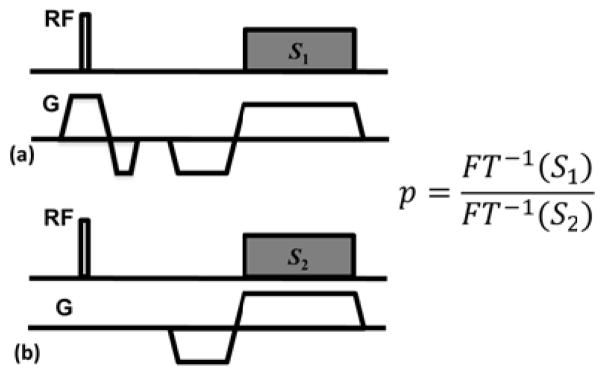
Fig. 3.

Pulse sequence diagram for RF pulse excitation profile measurement. The signals from acquisitions a) and b) are first transformed into image space by inverse Fourier transform, generating projections with and without modulation excitation profile. The profile is then obtained by taking ratio between the projections.
