
Figure 19.1.
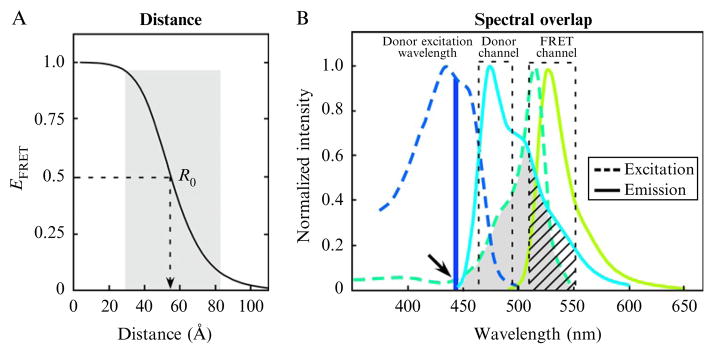
The distance dependence (A) and the spectral overlap (B) requirements for efficient FRET. (A) The efficiency of energy transfer, EFRET, was determined using Eq. (19.1), and is plotted as a function of the separation distance in Å. The shaded region illustrates the range of 0.5 R0 to 1.5 R0 over which FRET can be accurately measured. (B) The excitation and emission spectra for the CFP (donor) and YFP (acceptor) FRET pair are shown, with the shaded region indicating the spectral overlap between the donor emission and acceptor excitation. The dashed boxes indicate the donor (480/40 nm) and FRET (530/43 nm) detection channels. The arrow indicates the direct acceptor excitation at the donor excitation wavelength, and the hatching shows donor SBT into the FRET channel.