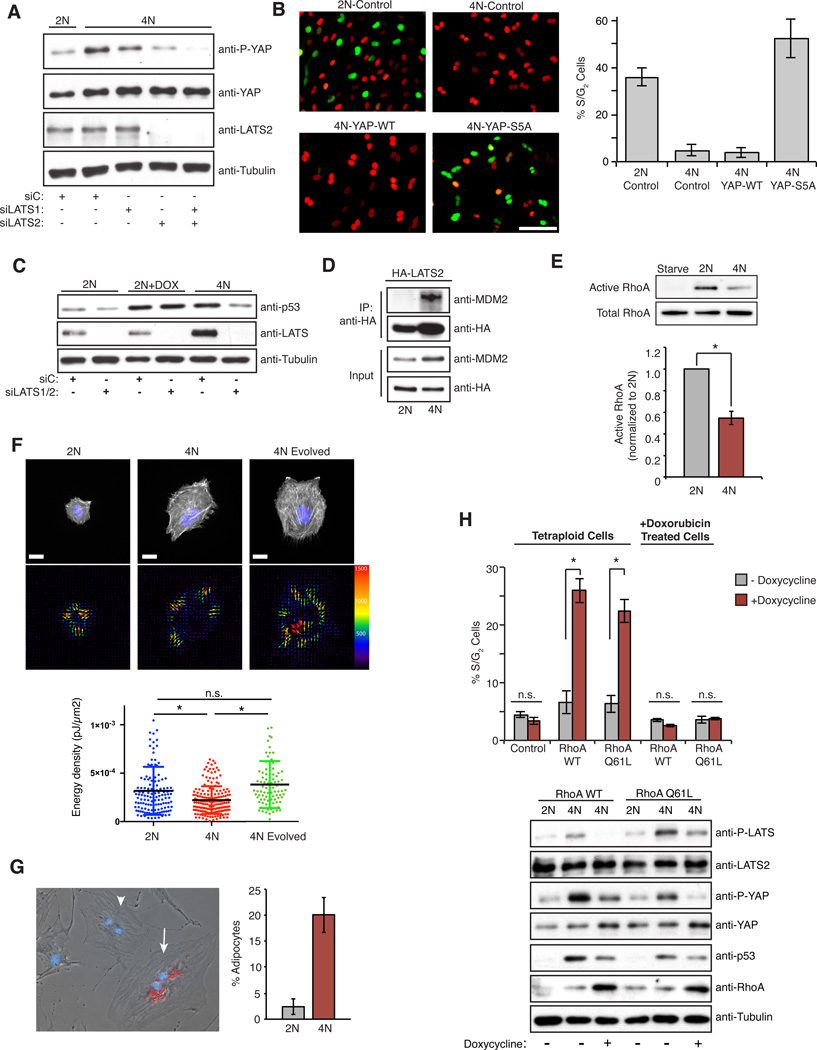
Figure 4. LATS2 inhibits the proliferation of tetraploid cells by stabilizing p53 and inactivating YAP, and is triggered by reduced RhoA activity.
(A) Western blot of p53, LATS2, and active YAP (p-S127) levels in 2N and 4N cells transfected with the indicated siRNAs. (B) Representative images of 2N and 4N RPE-FUCCI cells overexpressing either empty-vector control (Control), YAP-WT, or YAP-S5A, with quantitation of the percentage of S/G2 cells for each condition shown on right (from one representative experiment). Scale bar, 100 µm. (C) Western blot analysis of p53 and LATS2 levels in 2N, 4N, and 40 ng/ml doxorubicin-treated 2N (2N +Dox) RPE-FUCCI cells transfected with the indicated siRNAs. (D) Co-immunoprecipitation of HA-tagged LATS2-WT and endogenous MDM2 from 2N and 4N RPE-1 cells using anti-HA antibodies (one of two independent experiments). (E) Western blot analysis and quantitation of pull-down assays to detect active RhoA relative to total RhoA in serum-starved, 2N, and 4N RPE-1 cells (n=4; *p < 0.0003, one sample t-test). (F) Top Row: 2N, 4N, and Evolved 4N RPE-1 cells labeled for actin (Life-Act, white) and DNA (blue) on a PAA hydrogel. Bottom Row: Images showing the force field corresponding to the upper cells. The size and color of the arrows correspond to traction force magnitude measured (in Pascals). Below: The average energy density generated by each cell. 2N and 4N data points are from 4 independent experiments; 4N Evolved data points are from 2 independent experiments; *p < 0.0001, unpaired t-test. Scale bar, 20 µm. (G) hMSCs grown in mixed differentiation medium and stained with Oil Red. A non-differentiated diploid hMSC (arrowhead) and a tetraploid adipocyte (arrow) are highlighted. Right: The percentage of diploid and binucleated tetraploid cells that differentiate into adipocytes (n=2 independent experiments). (H) The percentage of S/G2 tetraploid or doxorubicin-treated RPE-FUCCI cells ± induction of RhoA-WT, RhoA-Q61L, or empty-vector control (Control) for 20 h with the corresponding western blot analysis of Hippo pathway activation (n=3; *p < 0.005, unpaired t-test). All error bars represent mean ± SEM.

