
Extended Data Figure 9. Genic and phenotypic subset analyses for the composite set.
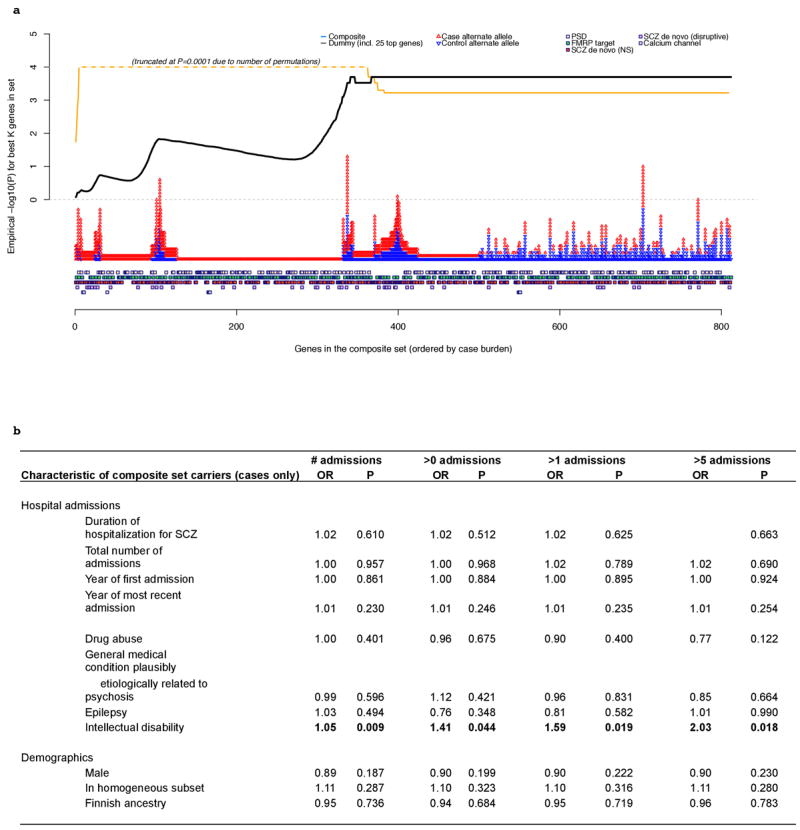
a. Individual gene-ranking of composite set genes. Genes are ranked by their case burden of rare disruptive mutations, from left to right, for the composite set. The squares along the bottom indicate to which sets each gene belongs. The red and blue triangles represent case and control counts for each gene. The lines above represent the statistical significance of the best test for this set: that is, the significance of the top K genes, evaluated by permutation. The black line represents results for the real data (disruptive MAF<0.1% composite set analysis). The orange line represents the dummy condition, in which we artificially constructed a set, where the number of genes, statistical enrichment, odds ratio and case/control counts where similar to the real composite set. However, this set included the 25 top-ranked genes from individual gene-based tests (disruptive MAF<0.1% variants), with the remainder selected at random. The profile of the best test line is markedly different between the real and dummy gene sets (note: truncated at P=0.0001 reflecting the number of permutations performed). Whereas the dummy P-value climbs quickly and then drops to the final aggregate result, the true composite set line continues to climb after 200 genes, indicating that many genes with a single disruptive mutation contribute to the observed set enrichment (rather than a relatively small proportion of the 1,796 genes accounting for the majority of the signal, as in the dummy set). b. Phenotypic characteristics of cases carrying mutations. Relationship between clinical and demographic measures in schizophrenia cases in relation to carrying one or more composite set disruptive risk alleles (MAF<0.1%). Hospital Discharge Registry data (ICD9 codes) were available on 979 of the 990 case carriers. All P-values (uncorrected) are two-sided from a case-only joint logistic regression of carrier status (one or more risk alleles) on all admission and demographic variables including year of first and last admissions. The four pairs of columns represent analyses in which we varied the way in which the HDR admission data were represented (for drug abuse, general medication condition, epilepsy and intellectual disability). “# admissions” = independent variables are the untransformed number of admissions; “>X admissions” = independent variable is binary 0/1 variable representing whether individuals had more than X admissions. Of all clinical/demographic measures considered, we observed a nominally-significant increased likelihood that cases carrying a disruptive allele in the composite set have increased rates of secondary diagnoses of intellectual disability compared to other cases (based on HDR ICD9 codes).