. 2014 Aug 19;3:e02951. doi: 10.7554/eLife.02951

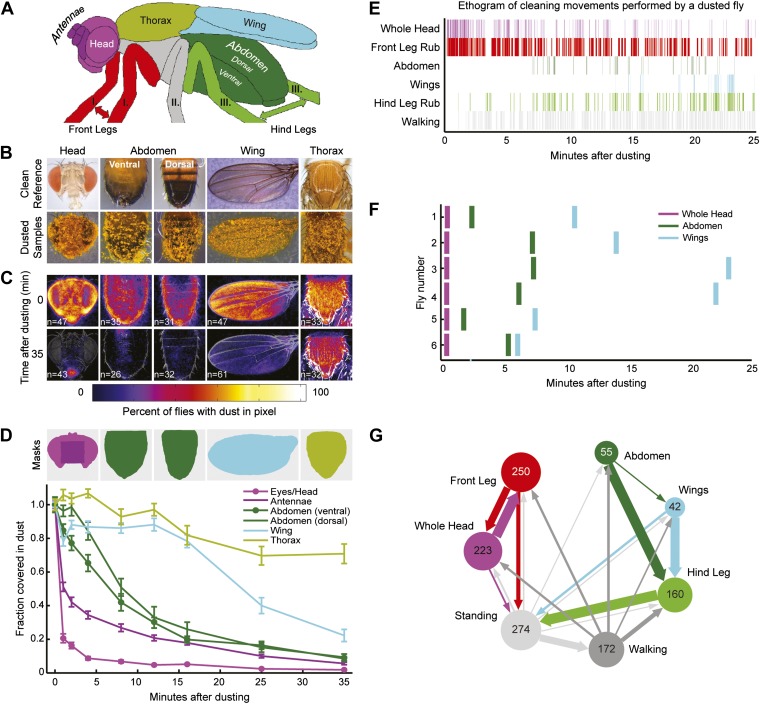
Figure 1. Wild-type flies clean different areas of the body sequentially.

(A) Diagram of body parts cleaned by front leg (red hues) or hind leg (green hues) movements. (BD) Dust distribution measurements of the bodies of flies that were coated in yellow dust and allowed to groom. (B) Body parts were imaged (dusted samples) and aligned to clean reference images in order to determine the fraction of dust left on each part. (C) Average spatial distribution of dust 0 min after dusting and after flies groomed for 35 min. The number of flies contributing to each heat map is displayed. (D) Dust removal across a 35-min time course. Masks define regions for counting the yellow pixels (dust) remaining on each sample. Each time point (normalized to 0-min samples) is plotted as the fraction of dust left in the defined regions and shown as the mean ± SEM; n ≥ 26 flies. Figure panel is compiled from data shown in Figure 1—figure supplement 3. (E) Representative ethogram of the five most common cleaning movements performed by an individual fly after dusting (manually scored from video recordings). All head cleaning movements are binned because eye and antennal cleaning are not easily distinguishable in the dusted state using our analysis methods (labeled whole head). (F) Latency to the first bout of head, abdomen, or wing cleaning after dusting for each of six flies annotated. (G) Transitions among different body cleaning movements, standing, and walking (across a 25-min time course, n = 6 flies). The radii of the nodes are proportional to the log of the average fraction of total cleaning bouts for each movement. Average total bouts for each movement are shown. Arrow widths represent the transition probabilities between the movements (displaying transition probabilities ≥0.05).

DOI: http://dx.doi.org/10.7554/eLife.02951.003

Figure 1.

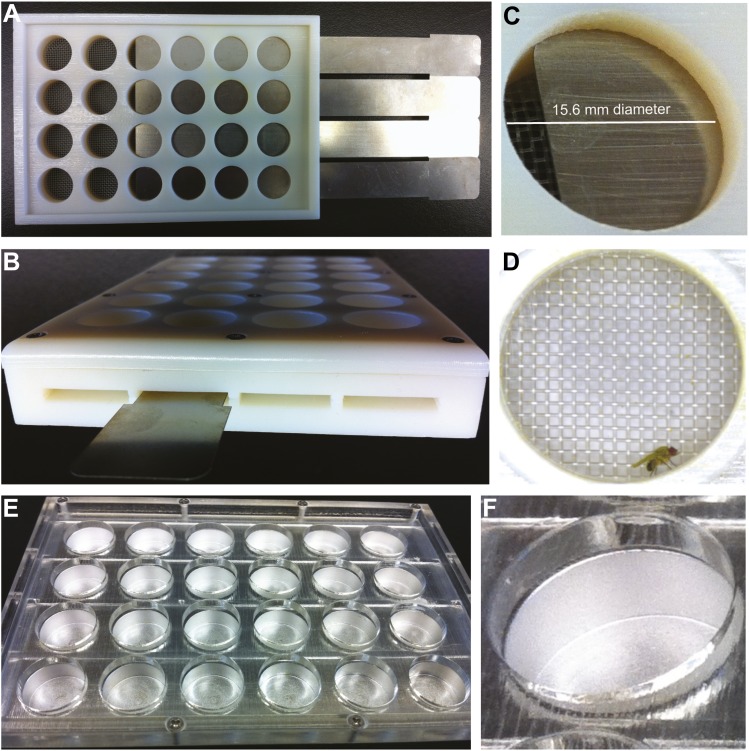
Figure 1—figure supplement 1. Grooming apparatus for dusting, recording, and observing flies.

Figure 1—figure supplement 1.

(A) Mesh-covered chambers allow free dust to exit while preventing flies from escaping. Connector side shown with some wells closed using slider gates. (B) Sliders gate the chambers for transferring flies and preventing escape. (C) View of a single grooming chamber with the gate partially open. (D) The connector side fits standard multiwell plates for fly dusting (not shown), clear viewing plugs for recording videos (D), and an adaptor for transferring flies between chambers (not shown). (D) Image from a video recording of a dusted fly used to score cleaning movements. (E and F) Shows the aluminum version of the apparatus for rapid cooling of flies. This version was used for the experiment shown in Figure 3C. All displayed grooming chambers are 15.6 mm in diameter.

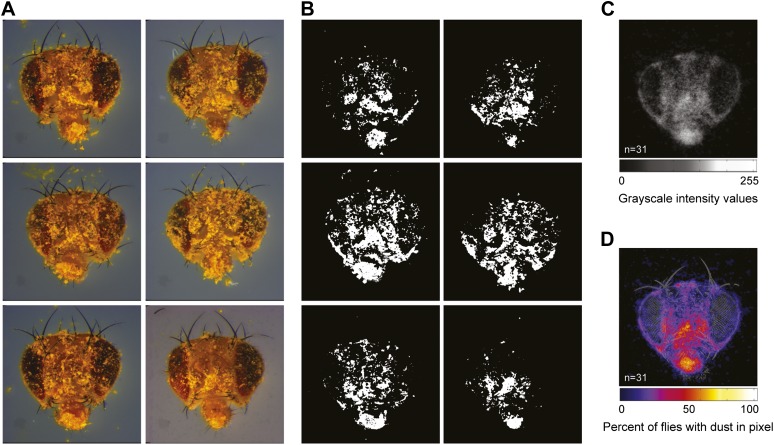
Figure 1—figure supplement 2. Strategies for quantifying dust on the body surface.

Figure 1—figure supplement 2.

(A) Examples of dusted flies that were allowed to groom for 1 min before their heads were dissected and imaged (showing 6 of 31 total images for this time point). (B) Each image was manually warped to a standard head (shown in Figure 1B), the dust-positive yellow pixels were isolated and converted to grayscale, and all dust pixels were set to 255 intensity values (8 bit). The numbers of white pixels in each image were counted in different regions specified by masks shown in Figure 1D. (C) Average projections were generated from the stack of 31 images. (D) A grayscale color map was produced using the average projection intensity values.

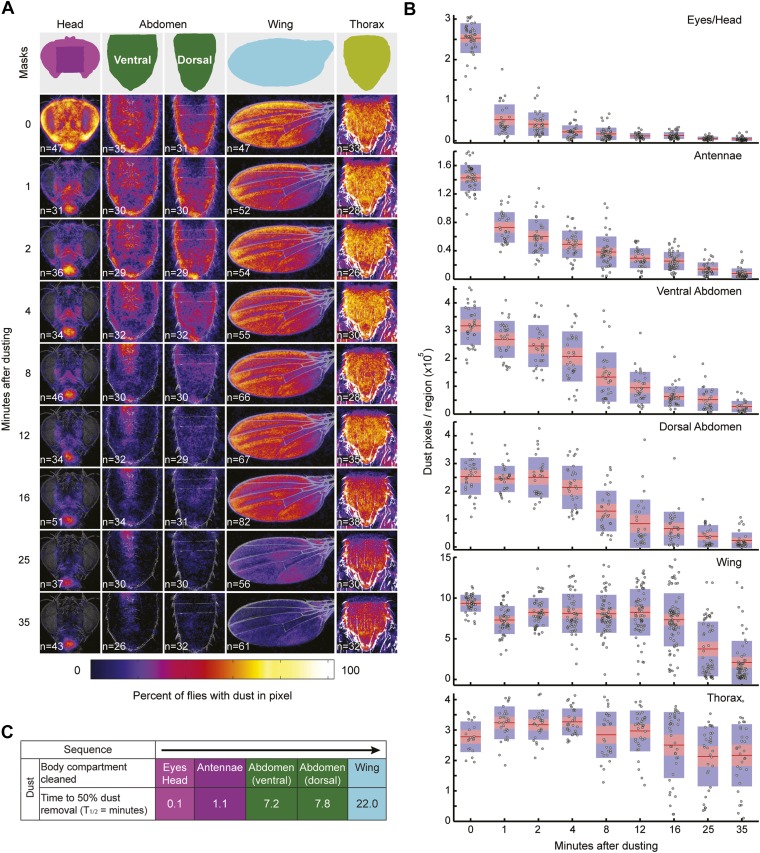
Figure 1—figure supplement 3. Wild-type flies remove dust from body parts at different rates.

Figure 1—figure supplement 3.

Data shown here is compiled and plotted in Figure 1D. (A) Average dust patterns of the body parts of Canton S flies at different time points after dusting. Masks used for defining regions of the body parts for counting dust pixels are shown on top. (B) Distribution plots of quantified dust pattern data. Each point on the plots represents the number of yellow pixels from the body part sample images. The mean is shown as a red line, 1.96 SEN (95% confidence interval) is in red, 1 SD is blue. (C) Curve fit summary of each body part. Curves were fit to either sigmoidal or exponential equations. Values represent the time it took for flies to clean fifty percent of each body part.

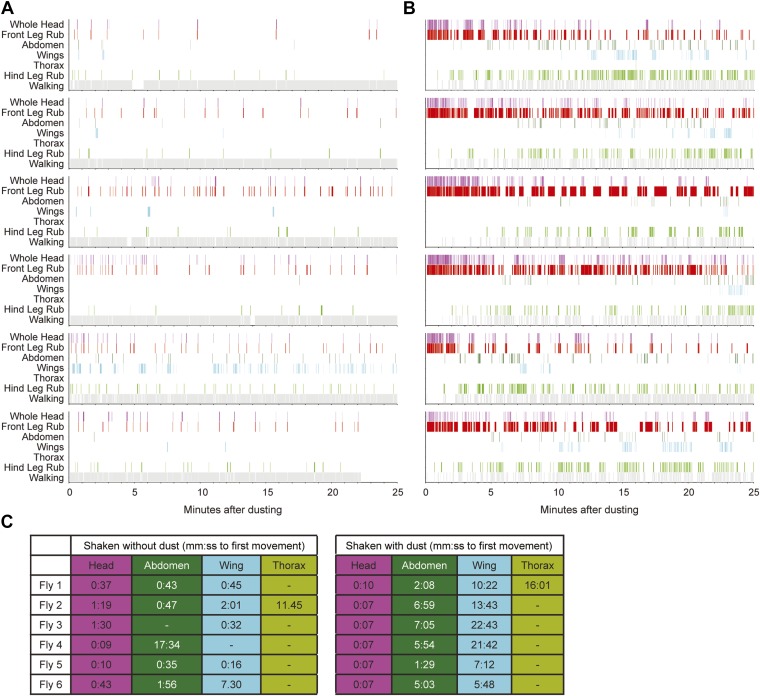
Figure 1—figure supplement 4. Sequential cleaning of the head, abdomen, and wings requires dust.

Figure 1—figure supplement 4.

(A and B) Cleaning movement ethograms of individual Canton S flies in response to being shaken without (A) and with (B) dust (n = 6 flies for each condition). (C) Table of the time to the first appearance of different cleaning movements for both undusted and dusted flies. Head cleaning movements are all binned because of the difficulty distinguishing between eye and antennal cleaning when flies were dusted (labeled whole head).

Figure 1—figure supplement 5. Transitions among cleaning movements of dusted wild-type flies.

Figure 1—figure supplement 5.

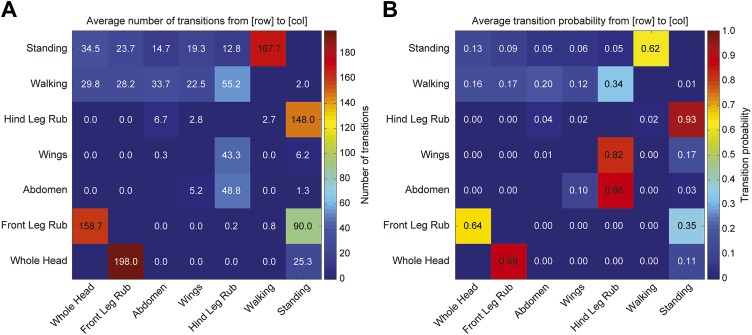
Canton S flies were shaken with dust. (A and B) The number of first order transitions between movements (A) and the transition probabilities are shown (B). Data were collected from 25 min of manually scored video (n = 6 flies for each treatment). Movements were binned into whole head, abdomen, wing, and leg rubbing.

Figure 1—figure supplement 6. Transitions among cleaning movements performed by dusted wild-type flies over a time course.

Figure 1—figure supplement 6.

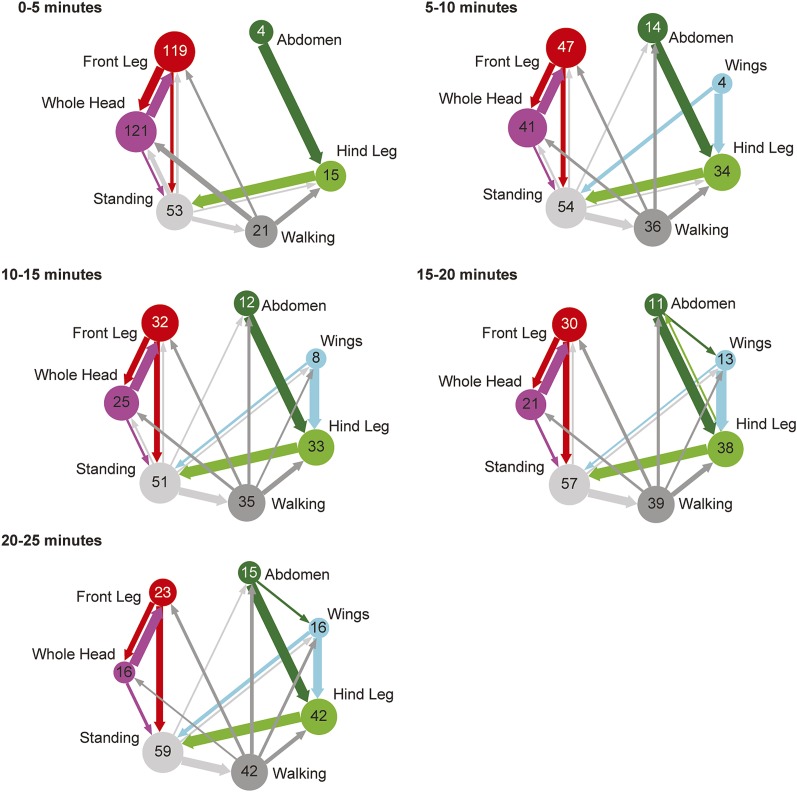
Diagrams are generated from manually scored video in 5-min bins, over a 25-min time course (n = 6 flies). The radii of the nodes are proportional to the log of the average fraction of total cleaning bouts for each movement per time bin. Average total bouts for each movement are shown. Arrow widths represent the transition probabilities between the movements (displaying transition probabilities ≥0.05).