. 2014 Aug 19;3:e02951. doi: 10.7554/eLife.02951

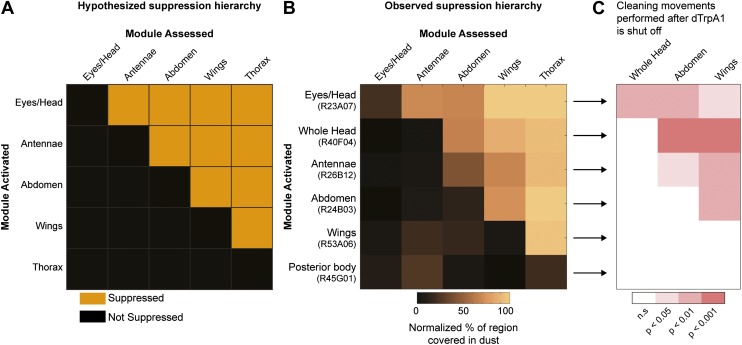
Figure 3. Hierarchical suppression and dust stimulus drive cleaning movement selection.

Cleaning of specific body parts was artificially activated while flies were dusted to stimulate competition between their cleaning movements. Flies were pre-warmed at 30°C such that the dTrpA1-induced cleaning module was active at the time of dusting. After grooming for 25 min, flies were anesthetized and their dust patterns were measured. (A) Grid showing the expected suppression pattern if the hierarchical suppression hypothesis is true. Modules are arranged on the grid in the order that they occur in the normal grooming sequence. (B) The observed suppression hierarchy. For each line, the normalized fraction of dust remaining on different regions of the flies is mapped onto the corresponding grid locations (n ≥ 26 per body part, ‘Materials and methods’). The module activated by each GAL4 line is listed above the line name. Data used to generate the grid is shown in Figure 3—figure supplement 1. (C) Cleaning movements performed when a GAL4/dTrpA1-activated module is shut off. Arrows from B to each row in C show the GAL4 line and corresponding dust distribution that was tested. The grid displays increases from control flies in the frequencies of different cleaning movements performed in the first 3 minutes after shutting off dTrpA1 (n = 10 flies per line). Grid heat map represents the p-values for the comparisons of the different GAL4 lines and control flies (Kruskal–Wallis followed by Mann–Whitney U pairwise tests and Bonferroni correction). Movements were manually scored. All head cleaning movements are binned and displayed as whole head, because eye and antennal cleaning are not easily distinguishable in the dusted state. Control and experimental flies performed few thoracic cleaning bouts and are therefore not shown.

DOI: http://dx.doi.org/10.7554/eLife.02951.022

Figure 3.

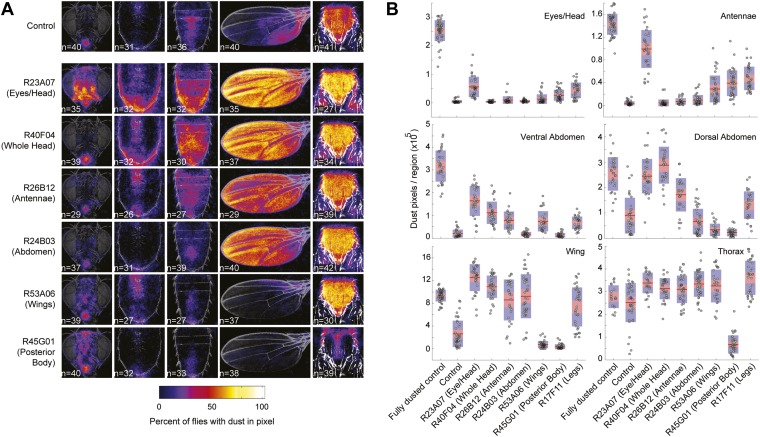
Figure 3—figure supplement 1. Dust patterns resulting from coating flies in dust and artificially activating specific cleaning movements.

Figure 3—figure supplement 1.

(A) Dust patterns of UAS-dTrpA1-activated cleaning lines 25 min after dusting (described in Figure 3). Average dust patterns are displayed as previously described in Figure 1B. (B) Distribution plots of quantified dust pattern data. Each point on the plots represents the number of yellow pixels from the body part sample images. The mean is shown as a red line, 1.96 SEM (95% confidence interval) is in red, 1 SD is blue. UAS-dTrpA1-activation phenotypes are listed with the name of each GAL4 line. Control flies show remaining dust levels when no module activated. Data shown here is compiled and plotted in Figure 3B.
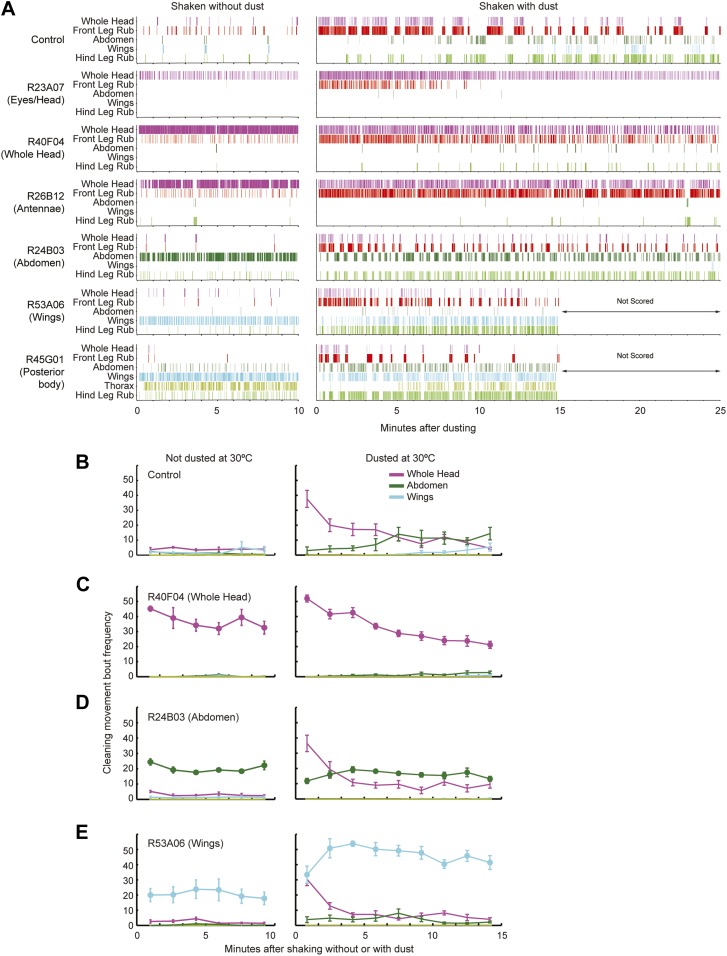
Figure 3—figure supplement 2. Behaviors of flies that were coated in dust while specific cleaning movements were artificially activated.

Figure 3—figure supplement 2.

Flies were pre-warmed at 30°C such that the dTrpA1-activated cleaning movement was being performed at the time of dusting. They were shaken with or without dust and allowed to groom while their cleaning movements were recorded for behavioral analysis. (A) Representative manually annotated ethograms of GAL4 lines expressing dTrpA1 that were shaken with and without dust. The most common mutually exclusive movements performed by individual flies are displayed. R53A06 and R45G01 were not scored beyond 15 min because they had already progressed through the cleaning sequence. (BE) Most head cleaning bouts occur at the beginning of grooming both in wild-type flies and when other cleaning movements are artificially activated. Number of cleaning movements for each major body part in 100 s intervals after flies were shaken without or with dust (plotted as the mean ± SEM; n = 5). Different lines displayed are: control (B), R40F04-GAL4/UAS-dTrpA1 (head cleaning) (C), R24B03-GAL4/UAS-dTrpA1 (abdominal cleaning) (D), R53A06-GAL4/UAS-dTrpA1 (wing cleaning) (E). Artificially activated movements are displayed as lines with filled circles at each time interval. Dust stimulated cleaning movements (not artificially activated) are shown as lines with no filled circles. All head cleaning movements are combined (labeled whole head). Friedman tests show a statistical difference between points in each head cleaning curve with dusted flies. This demonstrates that the numbers of head cleaning bouts at the beginning of grooming are higher than those at the end of the time course (p values for each line shown as undusted, dusted). Control (p = 0.817, p = 0.0004), R40F04 (p = 0.147, p = 0.00008), R24B03 (p = 0.3038, p = 0.0038), R53A06 (p = 0.0599, p = 0.0027). Other GAL4 lines showed similar results to these examples.
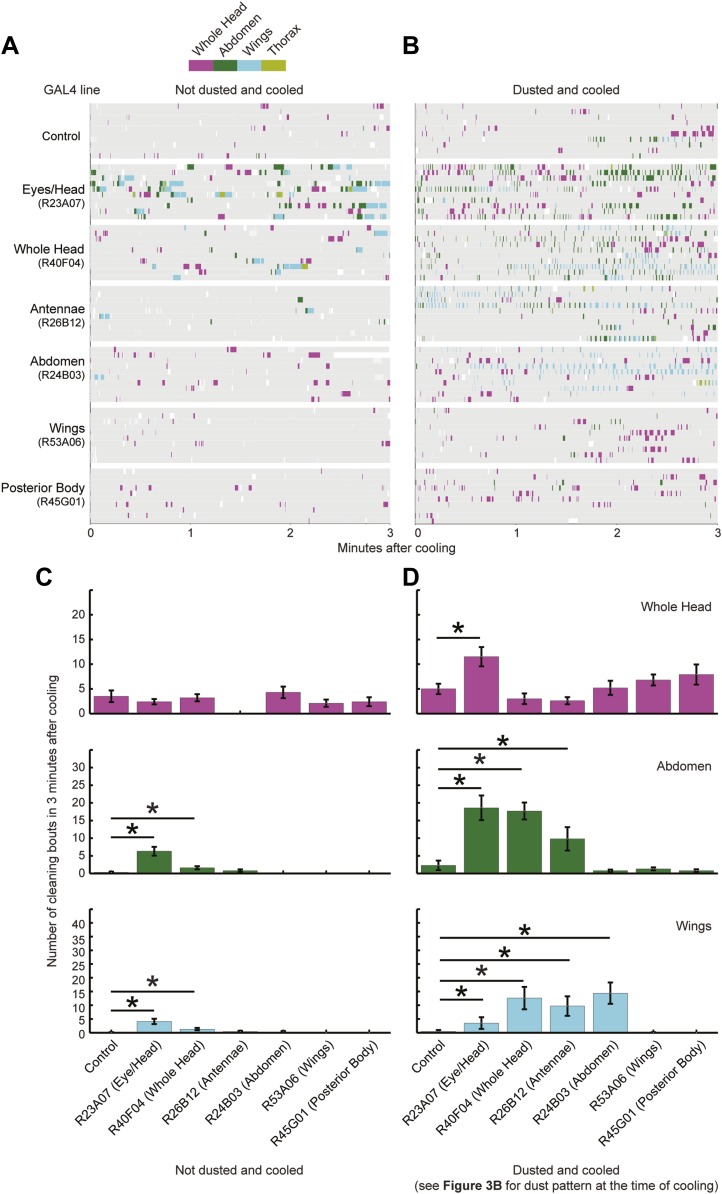
Figure 3—figure supplement 3. Triggering of cleaning movements is dust dependent.

Figure 3—figure supplement 3.

This experiment was designed to test between two possible mechanisms for the sequential induction of cleaning movements. One possibility is that activation of a preceding cleaning movement and its subsequent deactivation triggers the next movement. Alternatively, the next movement is completely determined by the distribution of dust on the body. (A and B) Cleaning movements performed during the first 3 min after the flies were cooled. GAL4 lines expressing UAS-dTrpA1 were shaken without (A) or with (B) dust and treated as described in the results. Movements were recorded and manually scored (n = 10 flies per line per treatment). Ethograms of the scored behaviors are displayed by compressing all mutually exclusive events to a single line for each fly. UAS-dTrpA1-activation phenotypes are listed with the name of each GAL4 line. (C and D) Bar graphs of the frequencies of different movements in the first 3 min after flies were cooled that were undusted (C) or dusted (D) (plotted as the mean ± SEM; n = 10). Head cleaning sub movements are all binned because they are not easily distinguishable from one another when flies are dusted (labeled whole head). Asterisks show samples that were significantly different from control from a Kruskal–Wallis test followed by Mann–Whitney U pairwise tests and Bonferroni correction (p < 0.05). Note that R23A07 and R40F04 showed increases in posterior cleaning movements that were not dust dependent. However, these movements were not increased to the same frequencies as those observed when the flies were dusted and cooled. Data shown in D is compiled and displayed in Figure 3C.