
Fig. 2.
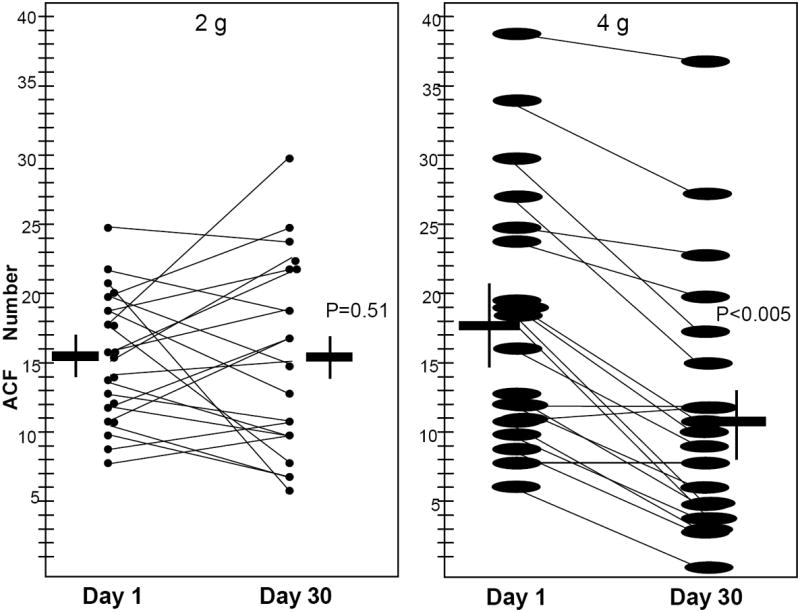
Human rectum with ACF number at initial exam and 30 days post treatment with 2 g or 4 g of curcumin. For each dose group, horizontal lines indicate the mean value for pre- and post-treatment levels in each dose group, with the standard error of the mean indicated by the endpoints of the corresponding vertical lines. Pre- and post-treatment levels of ACF number are plotted for each individual patient. The paired t-test was applied to examine change from pre-treatment levels in ACF number at a significance level 0.05.