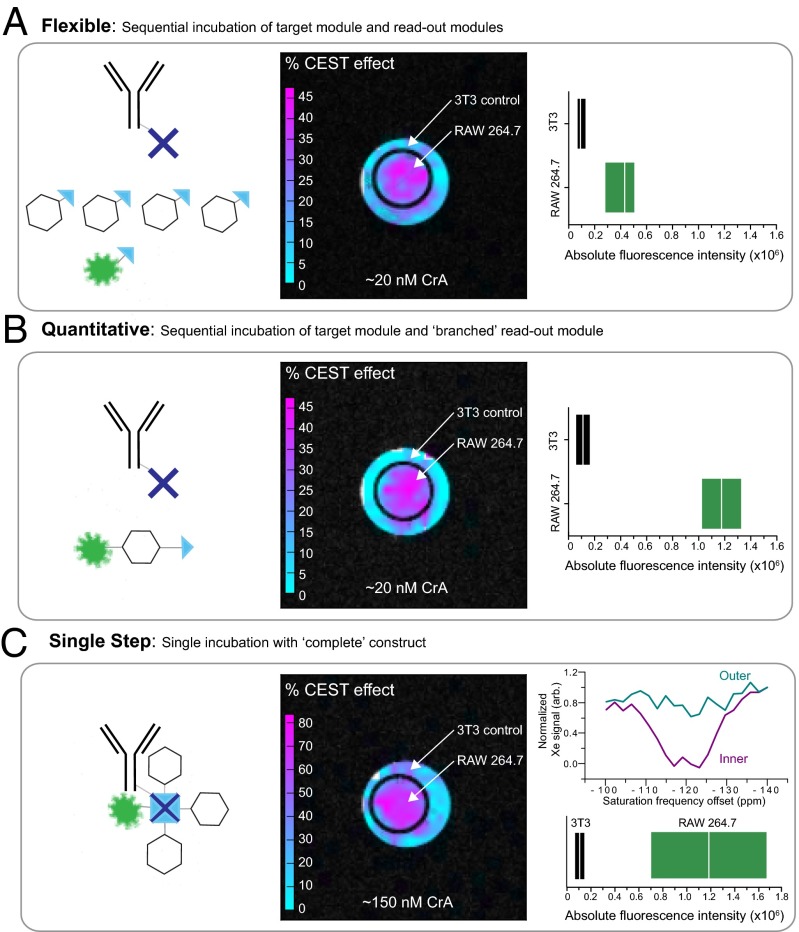
Fig. 3.
Cell-targeted xenon MRI. (Left) Cells were incubated either sequentially, first with the targeting module followed by the readout modules (either in a 4:1 ratio of CrA−biotin:fluorescein−biotin as in A or with the branched CrA−fluorescein−biotin readout module as in B. Alternatively, cells were incubated with the complete construct in which the targeting and readout modules were preconnected as in C. (Center) Xenon MRI scans indicate localization of the biosensor in the inner compartment containing the target cells, as determined by the high CEST effect. Images display CEST effect (false color) overlaid on proton MRI for reference (see Fig. S6 for details). Xenon CEST images using 30-μT, 26-s saturation pulse and 32 averages (A and B) or 10 averages (C) for each on- and off-resonance image. The calculated CrA concentration associated with cells in the inner compartment is shown at the bottom. A and B show similar maximum CEST responses, with C showing a much greater CEST response due to the more efficient delivery of CrA (color scale bars are different for A, B, and C). (Right) Cell specificity is confirmed by fluorescence as shown by box plots of the absolute fluorescence intensity of each cell population determined by flow cytometry, with median indicated by white line; range denotes first and third quartile. (C, Upper Right) Localized spectroscopy can also be obtained by acquiring images at different saturation frequencies and evaluating the signal from different compartments (inner and outer) throughout that image series (see Fig. S7 for details). Saturation parameters as for xenon CEST image.

