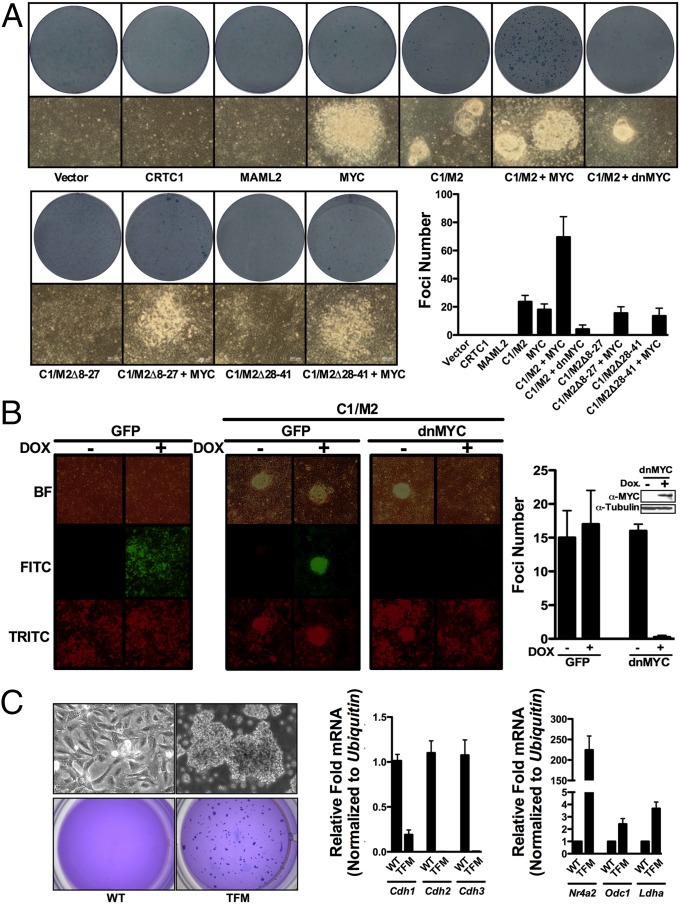
Fig. 3.
MYC is necessary for CTRC1/MAML2-directed transformation of epithelial cells. (A) Rat kidney epithelial cells (RK3E) were transfected with the indicated expression plasmids, plated, grown for 3 wk, and then fixed with methanol and stained with methylene blue to quantify foci formation. Representative images of foci morphology before staining (bottom photographs) along with wells after staining (Lower photographs) and quantitation of observed foci numbers are shown (n = 3). (B) TRE-Tight-C1/M2 Tet-On Advanced RK3E cells expressing Dox-inducible GFP (RK3E-CMVrtTA2-M2TRE-TightGFP-PGKtdTomato) or In373-dnMYC (RK3E-CMVrtTA2-M2TRE-TightdnMYC-PGKtdTomato) were assessed for foci formation following the induction of C1/M2 by Dox treatment. RK3E cells engineered to inducibly express GFP were allowed to form monolayers and then treated with Dox or vehicle for 72 h and imaged (Left). RK3E cells engineered to inducibly express GFP or In373-dnMYC were transfected with C1/M2, allowed to form monolayers, and then were treated with Dox or vehicle, and foci formation imaged and quantitated at 3 wk posttransfection (Right) (n = 2). (C) Myc augments the transforming potential of C1/M2 in primary RK3E cells. (Upper) Phase contrast of parental RK3E cells (WT) or RK3E transformed by C1/M2 plus MYC (TFM). (Lower) Colony formation in soft agar was assessed for RK3E WT or TFM cells. A total of 5 × 10³ cells were plated in 0.7% agar medium over agar underlayers. At 3 wk plates were stained with crystal violet to quantify colony numbers and were photographed. (Right) Real-time qPCR analysis of Cdh1-3, Nr4a2, Odc1, or Ldha levels in parental RK3E cells (WT) or in cells transformed with C1/M2 plus Myc (TFM). Fold changes are expressed relative to WT, and data are normalized to Ubiquitin mRNA levels (n = 4). Data in A–C represent mean ± SEM.

