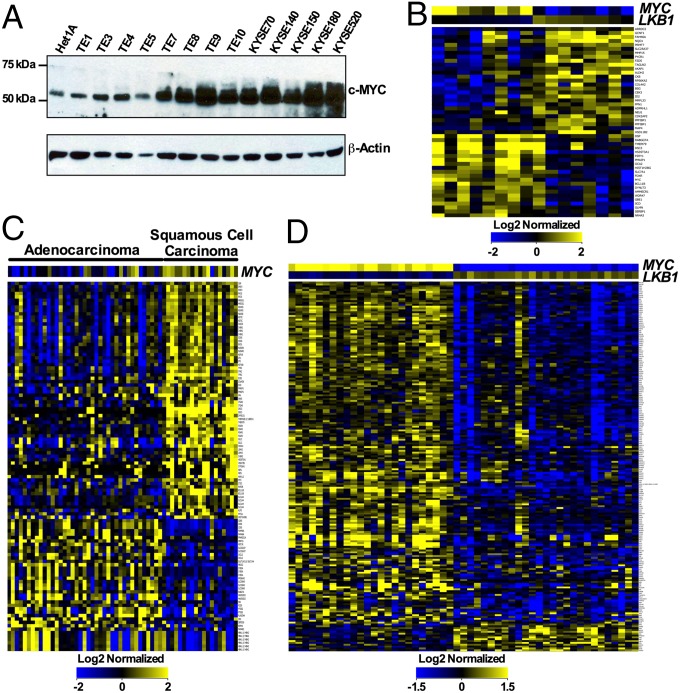
Fig. 5.
The C1/M2 gene signature predicts human malignancies with dual activation of MYC and CREB transcription networks. (A) Western blot analysis reveals increased MYC levels in several human esophageal cancer cell lines relative to immortal normal esophageal Het1A epithelial cells. (B) Hierarchical clustering of differentially expressed C1/M2-regulated CREB–MYC signature genes from multiple esophageal (n = 16) tumor samples based on an inverse correlation between MYC and LKB1 expression levels. The esophageal samples (75 total samples) were log2 normalized, the baseline transformation was set to the median of all samples, and then samples were divided into two groups relative to median MYC and LKB1 signals: HighMYC–LowLKB1 (eight samples) and LowMYC–HighLKB1 (eight samples). (C) Hierarchical clustering based solely on the presence of differentially expressed C1/M2-regulated CREB–MYC signature genes in lung adenocarcinoma and squamous cell carcinoma tumor samples. GCRMA quantile normalization was applied to the raw CEL files (58 total) for 40 lung adenocarcinoma and 18 squamous cell carcinoma samples, with baseline transformation set to the median of all samples. (D) Hierarchical clustering of differentially expressed C1/M2-regulated CREB–MYC signature genes from multiple lung adenocarcinoma samples (n = 51) based on an inverse correlation between MYC and LKB1 expression levels. GCRMA quantile normalization was applied to the raw CEL files (462 total), with baseline transformation set to the median of all samples. A total of 51 samples (either HighMYC–LowLKB1 or LowMYC–HighLKB1) were selected for further analysis based on identification of top (high) and bottom (low) quartile samples. Data in B–D represent fold change greater than 1.5 (P < 0.05).

