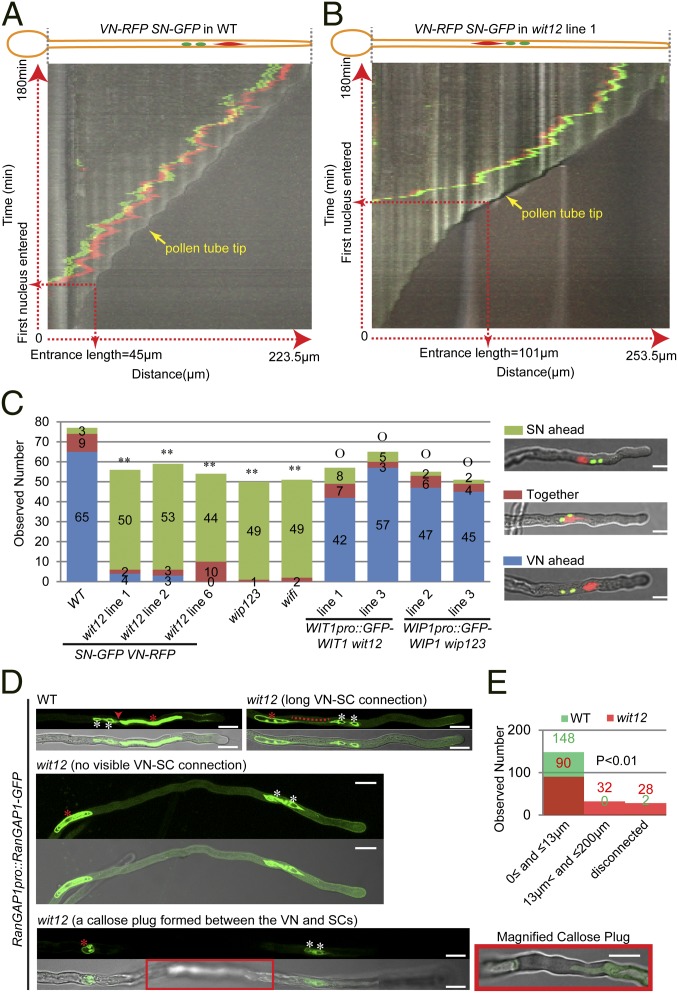
Fig. 3.
Nuclear movement in pollen tubes is affected in wit12, wip123, and wifi. (A) Kymograph of nuclear movement in a VN-RFP SN-GFP WT pollen tube. Vertical axis represents time (total = 180 min), and horizontal axis represents the distance along the pollen tube (total pollen tube length = 223.5 µm). (B) Kymograph of nuclear movement in a VN-RFP SN-GFP wit12 pollen tube. Vertical axis represents time (total = 180 min), and horizontal axis represents the distance along the pollen tube (total pollen tube length = 253.5 µm). (C) Nuclear order in pollen tubes after 5 h of germination. An example of each category is shown in Right. For wip123, wifi, and WIP1pro::GFP-WIP1 wip123 pollen tubes, Hoechst 33342 was used to stain DNA, and confocal microscopy was used for the others. Two-tailed Fisher exact test was used for statistical analysis, and numbers for each category are indicated on the graph. **P < 0.01 compared WT. OP > 0.05 compared with WT. (Scale bars: 10 µm.) (D) Position of the VN (red asterisks) relative to the SCs (white asterisks) after 16 h of semi-in vivo germination. In WT pollen tubes, the VN was closely associated with the SCs, and the connection (red arrowhead) was visible. However, in the wit12 pollen tubes, the connections were longer (red dotted line), undetectable, or interrupted by a callose plug (red box that is magnified at a focal plane clearly showing the plug). For each example, GFP signal is shown in the upper part, and the overlay with a bright-field image is shown in the lower part. The two examples in Middle and Bottom are maximum projections of z-stack images. Bottom was assembled from three continuous images by image stitching. (Scale bars: 10 µm.) (E) Quantification of the VN–SC distance after 16 h of semi-in vivo pollen germination. The shortest distance between the VNE and SC NE was measured. For either WT or wit12, one VN-RFP SN-GFP line and two RanGAP1pro::RanGAP1-GFP lines were used. Fifty pollen tubes were measured for each line. The VN, which were blocked by a callose plug or undetectable in over 300-µm pollen tubes, were considered disconnected. The numbers are indicated (green, WT; red, wit12). P < 0.01 represents the statistically significant difference between WT and wit12 (P < 0.01, n = 150, two-tailed Fisher exact test).

