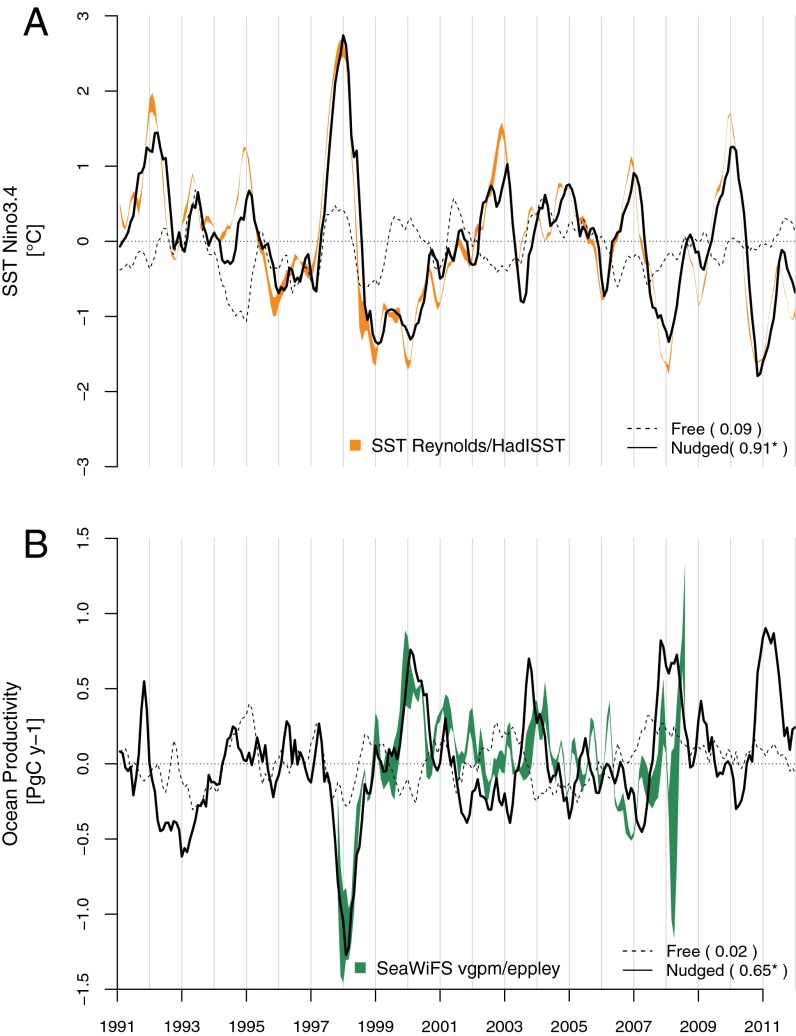
Fig. 1.
Monthly detrended anomalies of (A) SST represented by the Nino3.4 index, (B) NPP integrated over the low-latitude Pacific ocean (30°S–30°N) from January 1991 to December 2011. Color shading for SST (in orange) and NPP (in green) denotes an evaluation of the differences between two observationally derived data products, which consists in the SD between the Reynolds and the HadISST reanalyses for SST and the Eppley–VGPM and the VGPM algorithm for NPP. The dashed lines indicate the free ESM simulation, whereas the bold lines indicate ESM simulations with SST nudging. Correlation between each ESM simulations compared with the SST reanalyses and the satellite-derived NPP are bracketed; correlations that pass a t test at 95% of significance following Bretherton et al. (44) are indicated by an asterisk (*).

