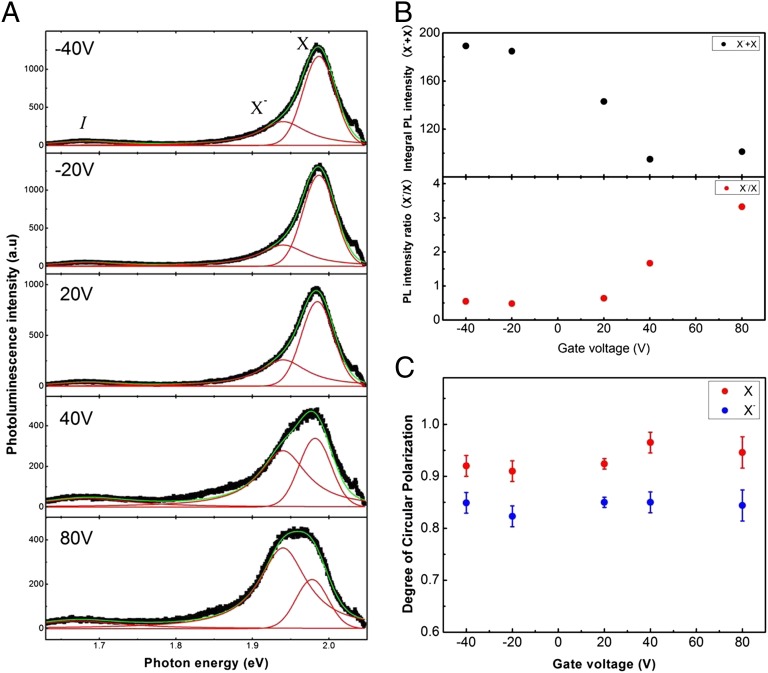
Fig. 4.
Electric-doping-dependent photoluminescence spectrum of bilayer WS2 field-effect transistor. (A) Luminescence spectra of bilayer WS2 at different gate voltage under near-resonant σ+ excitation (2.088 eV) at 10 K. X and X− denote neutral exciton and trion, respectively. Green curve is a fitting consisting of two Lorentzian peak fits (peak I and X−) and one Gaussian peak fit (peak X). (B) Intensity of exciton and trion emissions versus gate. (Upper) The gate-dependent integral PL intensity consisting of exciton (X) and trion (X−). (Lower) The ratio of the integral PL intensity of exciton versus that of trion, as a function of the gate voltage. (C) Degree of circular polarization of exciton (X, red) and trion (X−, blue) versus the gate.

