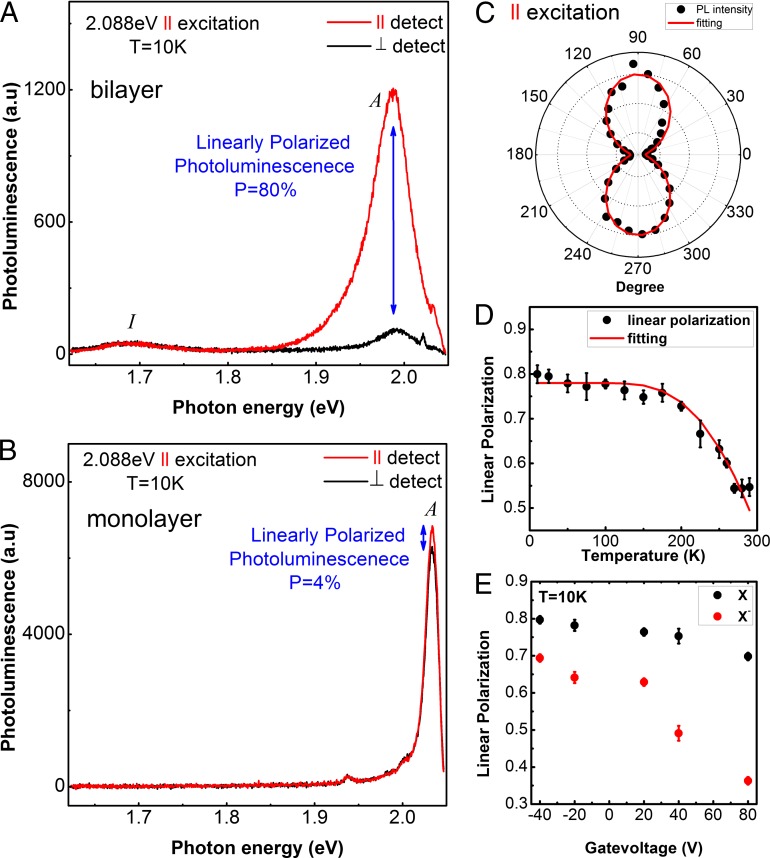
Fig. 5.
Linearly polarized excitations on monolayer and bilayer WS2. (A) Linear-polarization-resolved luminescence spectra of bilayer WS2 under near-resonant linearly polarized excitation (2.088 eV) at 10 K. Red (black) presents the spectrum with parallel (cross) polarization with respect to the linear polarization of excitation source. A linear polarization of 80% is observed for exciton A, and the indirect gap transition (I) is unpolarized. (B) Linear-polarization-resolved luminescence spectra of monolayer WS2 under near-resonant linearly polarized excitation (2.088 eV) at 10 K. Red (black) denotes the spectrum with the parallel (cross) polarization with respect to the linear polarization of excitation source. The linear polarization for exciton A in monolayer WS2 is much weaker, with a maximum value of 4%. (C) Polar plot for intensity of the exciton A in bilayer WS2 (black) as a function of the detection angle at 10 K. Red curve is a fit-following cos2(θ). (D) The degree of linear polarization of exciton A in bilayer WS2 (black) as a function of temperature. The curve (red) is a fit following a Boltzmann distribution where the intervalley scattering by phonons is assumed. (E) Electric doping dependence of the linear polarization of exciton A in bilayer WS2 at 10 K.

