Fig. 5.
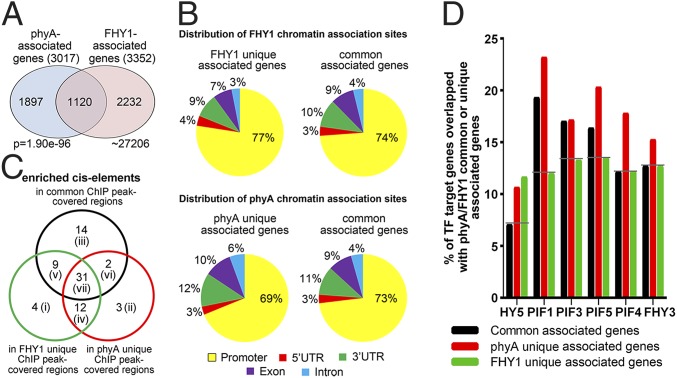
The preferences of FHY1 and phyA when associating with genes. (A) The common and unique associated genes of phyA and FHY1. The P value of the Venn diagram was calculated using the hypergeometric distribution. (B) Both FHY1 (Upper) and phyA (Lower) prefer to associate with the promoter regions of their unique genes as well as the promoters of common genes. (C) Different cis-elements are enriched in the coordinate and unique associations of phyA and FHY1. Enriched cis-elements located within common and unique ChIP peak-covered regions indicate coordinate and unique association sites of phyA and FHY1, respectively. (D) FHY1 and phyA prefer different transcription factors when associating with common or unique genes. Target genes of these transcription factors were overlapped with phyA/FHY1 common associated genes (black), phyA unique associated genes (red), and FHY1 unique associated genes (green) with different degrees.

