
Fig. 6.
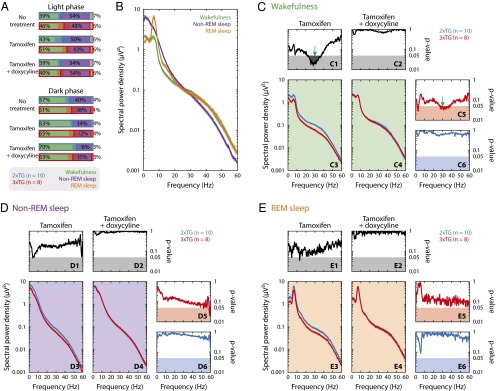
EEG power spectrum was altered by astrocyte-specific TeNT expression in a behavioral state-dependent manner. (A) Percentage of duration of awake (green), non-REM sleep (purple), and REM sleep (orange) during light (Upper) and dark (Lower) phases for 2xTG (blue, n = 10) and 3xTG (red, n = 8) under different treatments. Light-colored red and blue horizontal bars represent SD of population. (B) Behavioral state-dependent EEG power spectra for control animals (2xTG) without drug treatment. Solid green (awake), purple (non-REM sleep), and orange (REM sleep) curves represent different behavioral states of the animal. Light-colored shades: mean ± SEM (may not be visible because the width of the shade is comparable or less than the thickness of the curves). (C–E) Effects of tamoxifen and subsequent doxycycline treatments on EEG power spectra on 3×TG (red) and control (2×TG, blue) animals in awake (C), non-REM sleep (D), and REM sleep (E) state. (Lower Left) C3-4, D3-4, and E3-4 show mean (solid curve) and SEM (shade) of power spectra in response to tamoxifen (Left) and then doxycycline (Right) treatment. (Upper) C1-2, D1-2, and E1-2 show ANOVA P values between 3×TG and control groups as a function of frequency (solid line); shaded regions at the bottom mark statistical significance (P < 0.05). (Right) C5-6, D5-6, and E5-6 show ANOVA P values of comparison before and after doxycycline treatment for 3×TG (Upper: C5, D5, and E5) and control (Lower: C6, D6, and E6) animals. The reduction in spectral power density was statistically significant only in low-gamma range (20–40 Hz, green arrows) and only while the animals were awake.