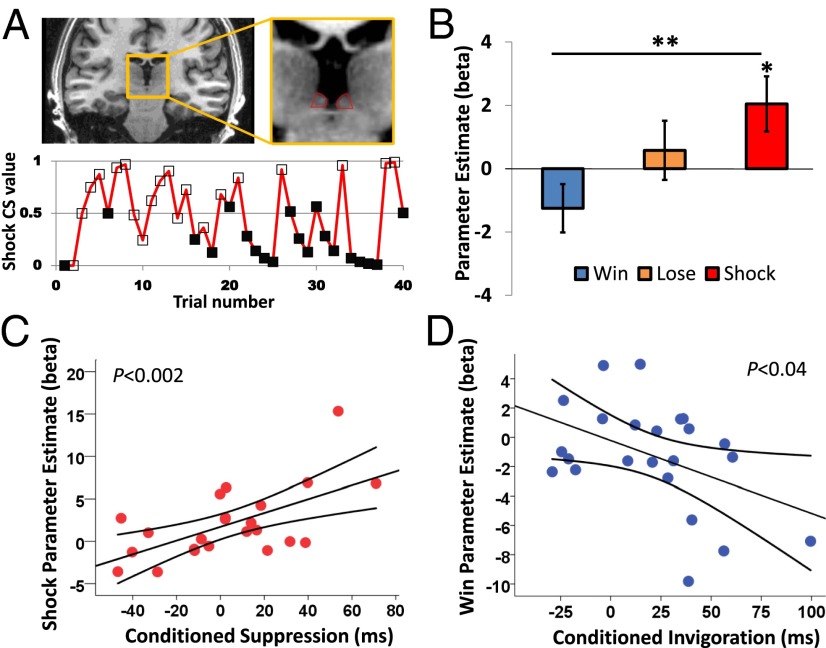
Fig. 2.
Habenula results. (A) Location of the habenula on a coronal slice of a representative subject (Upper) and the trial-by-trial evolution of shock CS value during a single task block for a representative subject (Lower). Empty markers (□) indicate high-probability trials, and filled markers (■) indicate low-probability trials. (B) BOLD responses from the right habenula correspond to the dynamically changing values of win, loss, and shock CSs. (C) There is a positive correlation between the right habenula response to shock CS value and conditioned suppression. (D) There is a negative correlation between the right habenula response to win CS value and conditioned invigoration. Error bars represent SEM. *P < 0.01; **P < 0.001.

