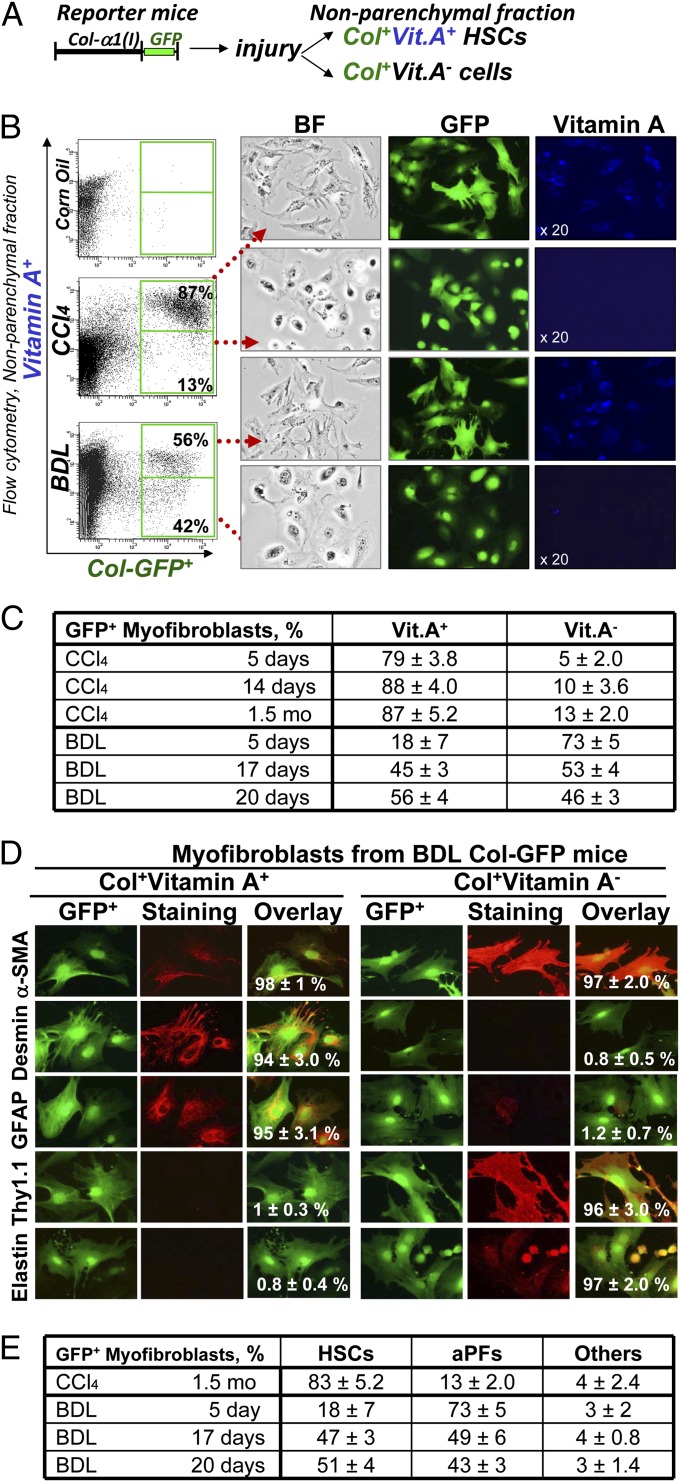
Fig. 2.
Detection, quantification, and isolation of liver myofibroblasts. (A) Strategy to analyze myofibroblasts by flow cytometry: Collagen type I-expressing myofibroblasts were identified in nonparenchymal fraction by GFP expression and further fractionated to Vit.A+ and Vit.A− cells. (B) FACS analysis of nonparenchymal fraction from untreated and BDL-, and CCl4- treated Col-GFP mice: GFP+ cells were detected by argon laser at 488 nm wavelength, and Vit.A+ cells were detected by violet laser at 405 nm wavelength. Representative dot plots are shown, P < 0.03. GFP+Vit.A+ and GFP+Vit.A− cells were sort purified and analyzed by light and fluorescent microscopy for GFP and Vitamin A expression (UV laser, 20× objective). (C) Flow cytometry-based quantification of GFP+ myofibroblasts. Expression of vitamin A in GFP+ cells was analyzed in nonparenchymal fraction of Col-GFP mice at different time points (n = 6 per time point) of CCl4 and BDL, P < 0.01. (D) Immunophenotyping of GFP+ myofibroblasts isolated from BDL mice. GFP+Vit.A+ and GFP+Vit.A− fractions were sort purified from Col-GFP mice (n = 6) after BDL (20 d). Expression of myofibroblast marker (α-SMA), HSC markers (desmin, GFAP, CD146), and PF markers (elastin, Thy1) were analyzed by immunocytochemistry using specific antibodies or isotype matched controls (40× objective). GFP+Vit.A+ and GFP+Vit.A− cells were identified as aHSCs and aPFs, respectively. For each fraction, the percent of positively stained cells is calculated (compared with total cells, 100%, P < 0.05). (E) Quantification of GFP+Vit.A+ and GFP+Vit.A− fractions is based on expression of HSC- and PF-specific markers in GFP+ myofibroblasts (100%) as detected by immunocytochemistry, P < 0.05.

